

Agonizing over typescript compilation times
by Alan Andrade
A productive morning turned into agony when I tried to commit my work. Every git commit runs through the pre-commit hooks first, and it was the typescript compilation check that blew my mind. At first, it crashed with an out of memory error. I had to increase Node’s memory limit and run my command again. I waited… for almost three minutes to get my work into the repository. “This shouldn’t be the case” I thought.
I took a deep breath, and with tea in hand, I started to investigate.
How much slower?
First I had to confirm that this problem was widespread and measure the impact. Luckily, the infrastructure team had set up observability dashboards on the CI pipelines and there was my answer.

Something happened around July 24 that doubled the time it took to compile typescript across a few projects. It went from ~5 minutes to ~10 minutes in one day.
Great! I’m not crazy nor impatient. So what could’ve caused this?
Detective Work
I had to debug the typescript compilation process. So I ran tsc –extendedDiagnostics. This flag exposes where TypeScript is spending its time when compiling. It’s a tool used for understanding the performance characteristics of your codebase overall.
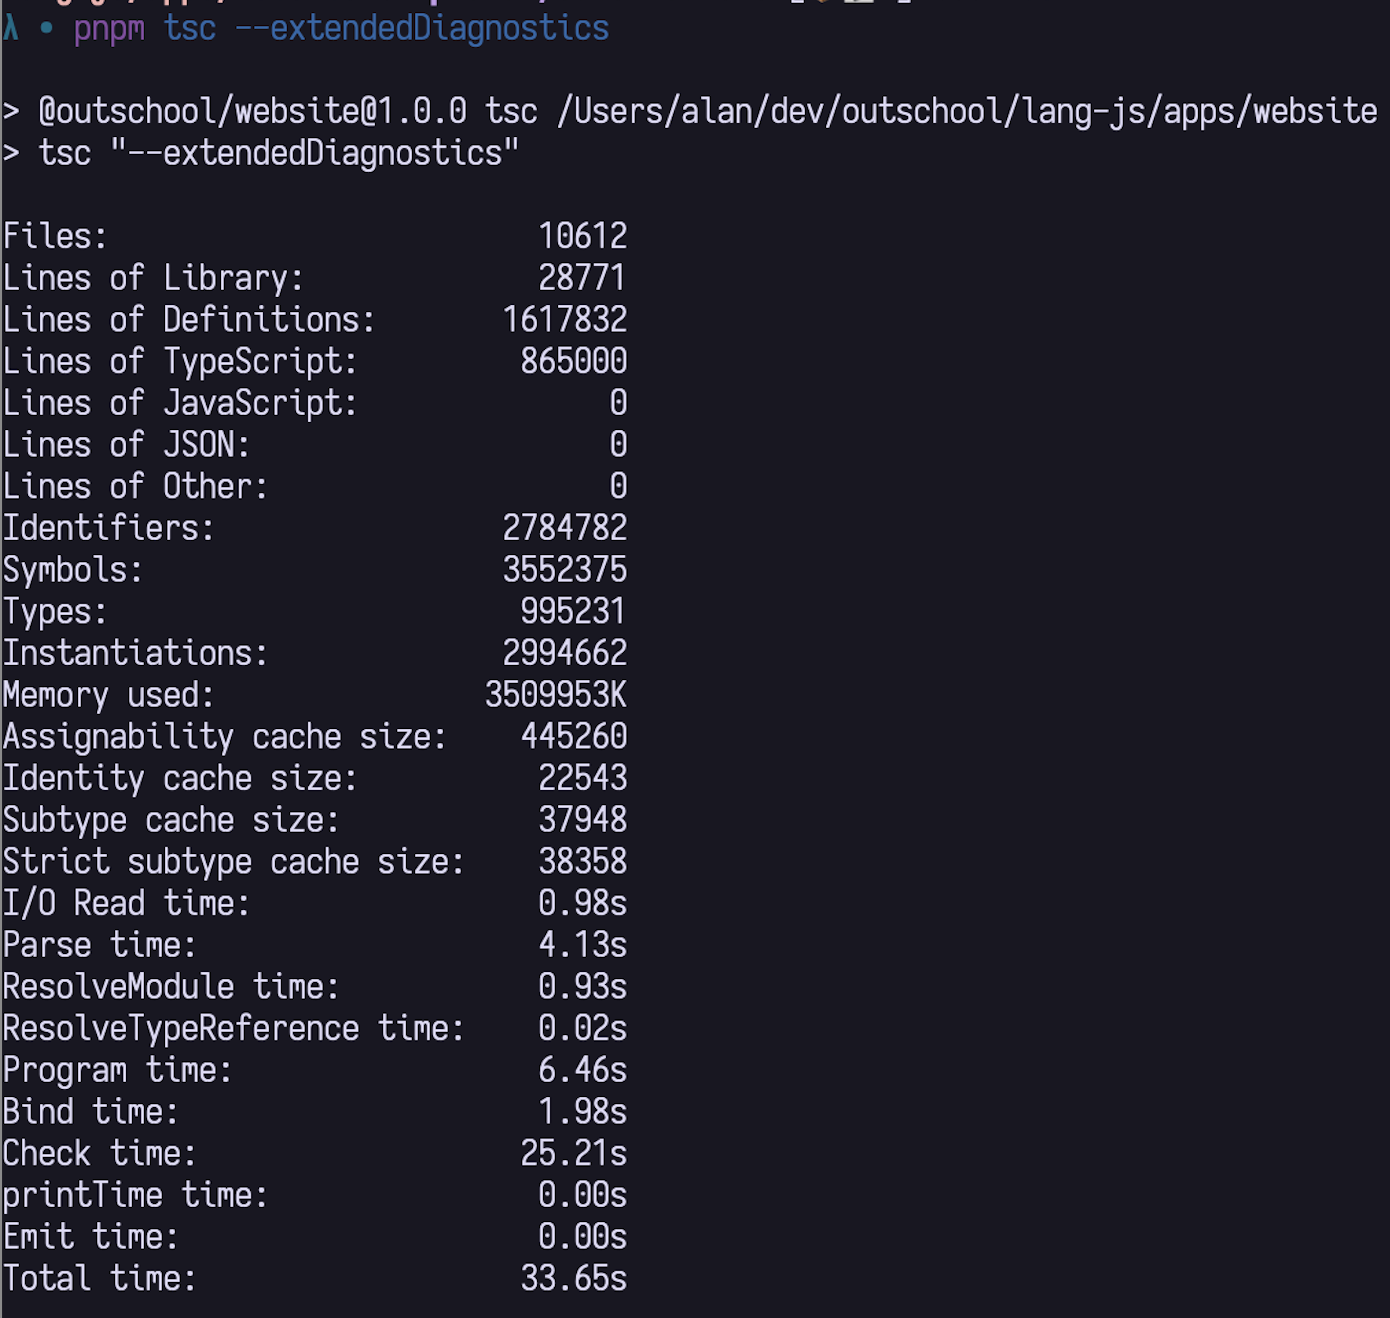
This was the result.
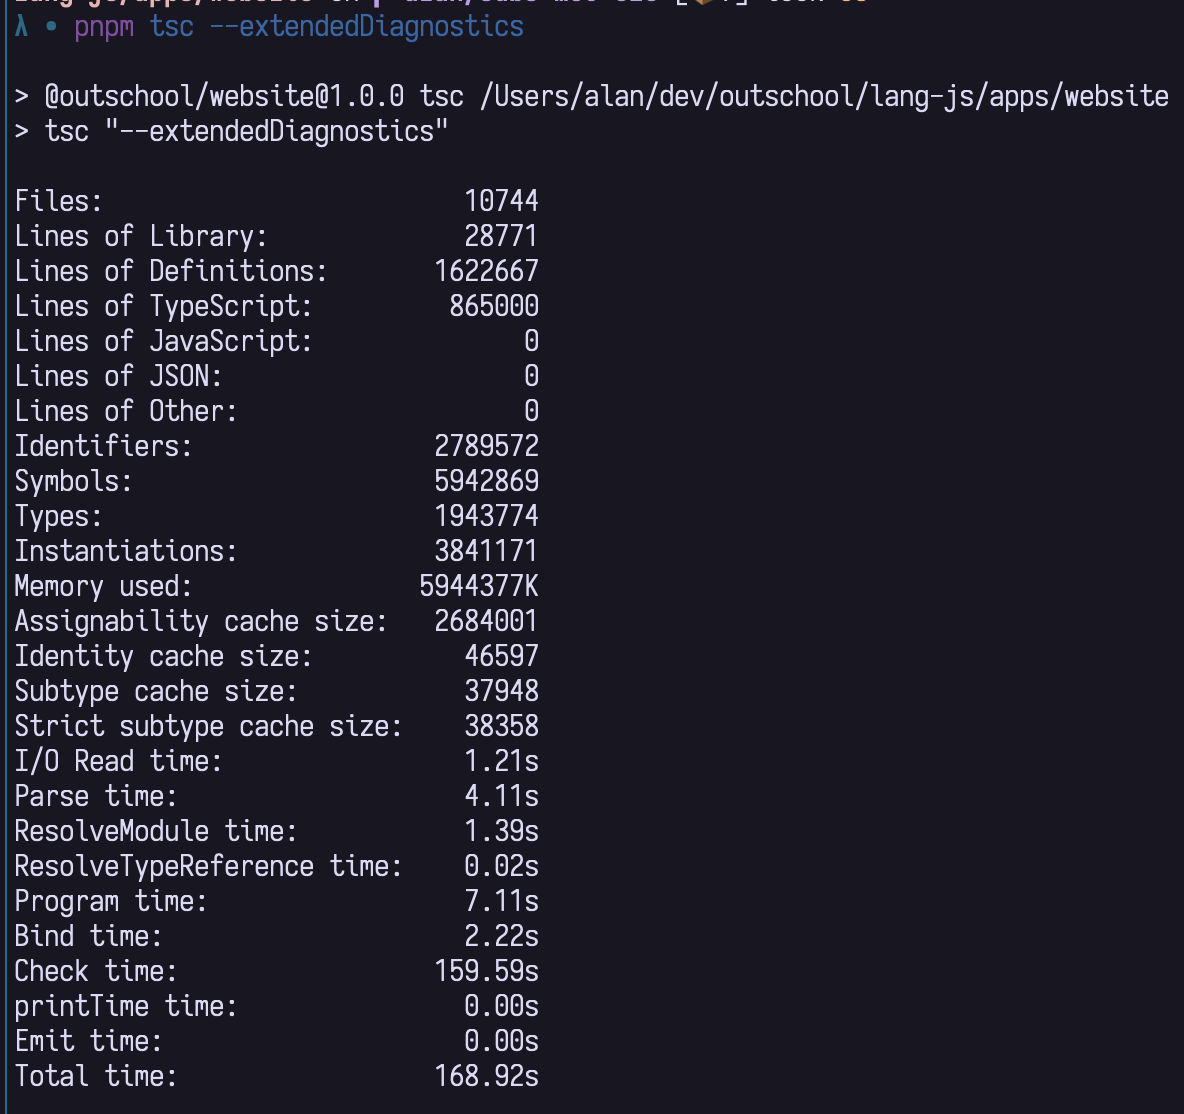
The total time to compile this project was 168 seconds. Ouch.
As a first step, I focused on the metrics that relate to time. Everything else could wait as I didn’t understand any of it. I noticed that the IO Read time, Parse time, Resolution, Program and Bind times looked relatively normal compared to the overall check time. The only one left was check time, which was taking 95% of the total compilation time. That seemed like a good candidate to investigate further.
But, how do you debug the typescript compilation process to learn why check time was taking so long?
Performance Tracing
To narrow down the problem I produced a typescript compilation trace. A compilation trace is essentially a visual map of all the steps that the compiler takes to check your program. This had to demonstrate why it had slowed down.
To achieve this, you have to run tsc –generateTrace outDir and then open the trace with Google Chrome or Edge. The file is in JSON format which comes with a related file named types. I won’t go over the details of the tool, but I recommend checking the typescript’s wiki if you’re interested in knowing more about it.
This was the resulting visualization of the trace.

To decipher this chart, it is relevant to understand the compiler at a high level. It has 5 main steps.
- Preprocessing: Resolve all imports to collect files
- Parsing: Generate an Abstract Syntax Tree (AST)
- Binding: Converts identifiers in the AST to symbols
- Type checking: Uses binder and syntax tree to look for issues in the code
- Transformation and File emission: Updates AST to match tsconfig options and prints it into a .js, .d.ts and other files
These steps are present in this chart, but are relatively small compared to the type checking step. We discovered that it takes 97% of the total compilation time. It makes the other steps relatively inconsequential. So let’s deep dive into it.
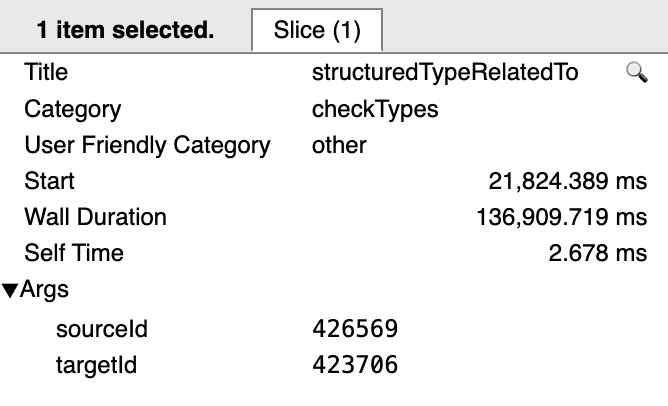
In the trace, I saw the hotspot in the center with boxes marked as structuredTypeRelatedTo. These are contained under the parent box checkSourceFile. So I follow the ancestry path: checkSourceFile => checkDeferredNode => structuredTypeRelatedTo. By clicking on each box and capturing the information in my notes for later analysis.
Here are the drilldown screenshots.


Tracking down the culprit
The information in the boxes gets more specific as you drill down. So I follow the file, then the position within the file and this is where I land.
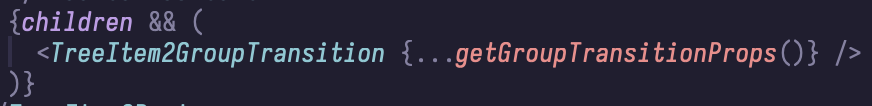
There are JSX properties spliced into an MUI component. I don’t understand what the big deal is and why this is taking so long to compile. So I kept digging.
As you can see above, the structuredTypeRelatedTo blocks have a sourceId and targetId. These ids map to a type, which I cross referenced in the types.json to get the specific type in context.
You can open the file in an editor and CMD+F. That felt unnecessarily slow, so this command was useful to get quicker and jq-pretty printed results. At the time of writing, every type id corresponds to the line number within the file. So to get the type for sourceId 50, you get the line 50 from the file.
head types.json -n 50 | tail -n -1 | jqI tracked down a few more types until I started to understand what the compiler was doing. The same type was being resolved from the same library but with a different version.
The type SystemCssProperties was being intersected with itself according to this trace which is annotated for clarity.
{
  "id": 423667,
  "recursionId": 331758,
  "intersectionTypes": [
	33876, // SystemCssProperties from Mui 5.16.4
	324403 // SystemCssProperties from Mui 5.15.14
  ],
  "flags": [
	"2097152"
  ]
}
This must be it. It doesn’t make sense that two types that are meant to represent the same are being intersected! Now… How can I fix it?
The Fix
My goal was to get the SystemCssProperties type from the same package, not from different versions. The project is a monorepo using pnpm. The solution is to set up an override for the Mui library to force it to resolve to a specific version across the whole monorepo.
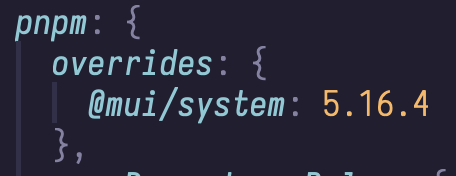
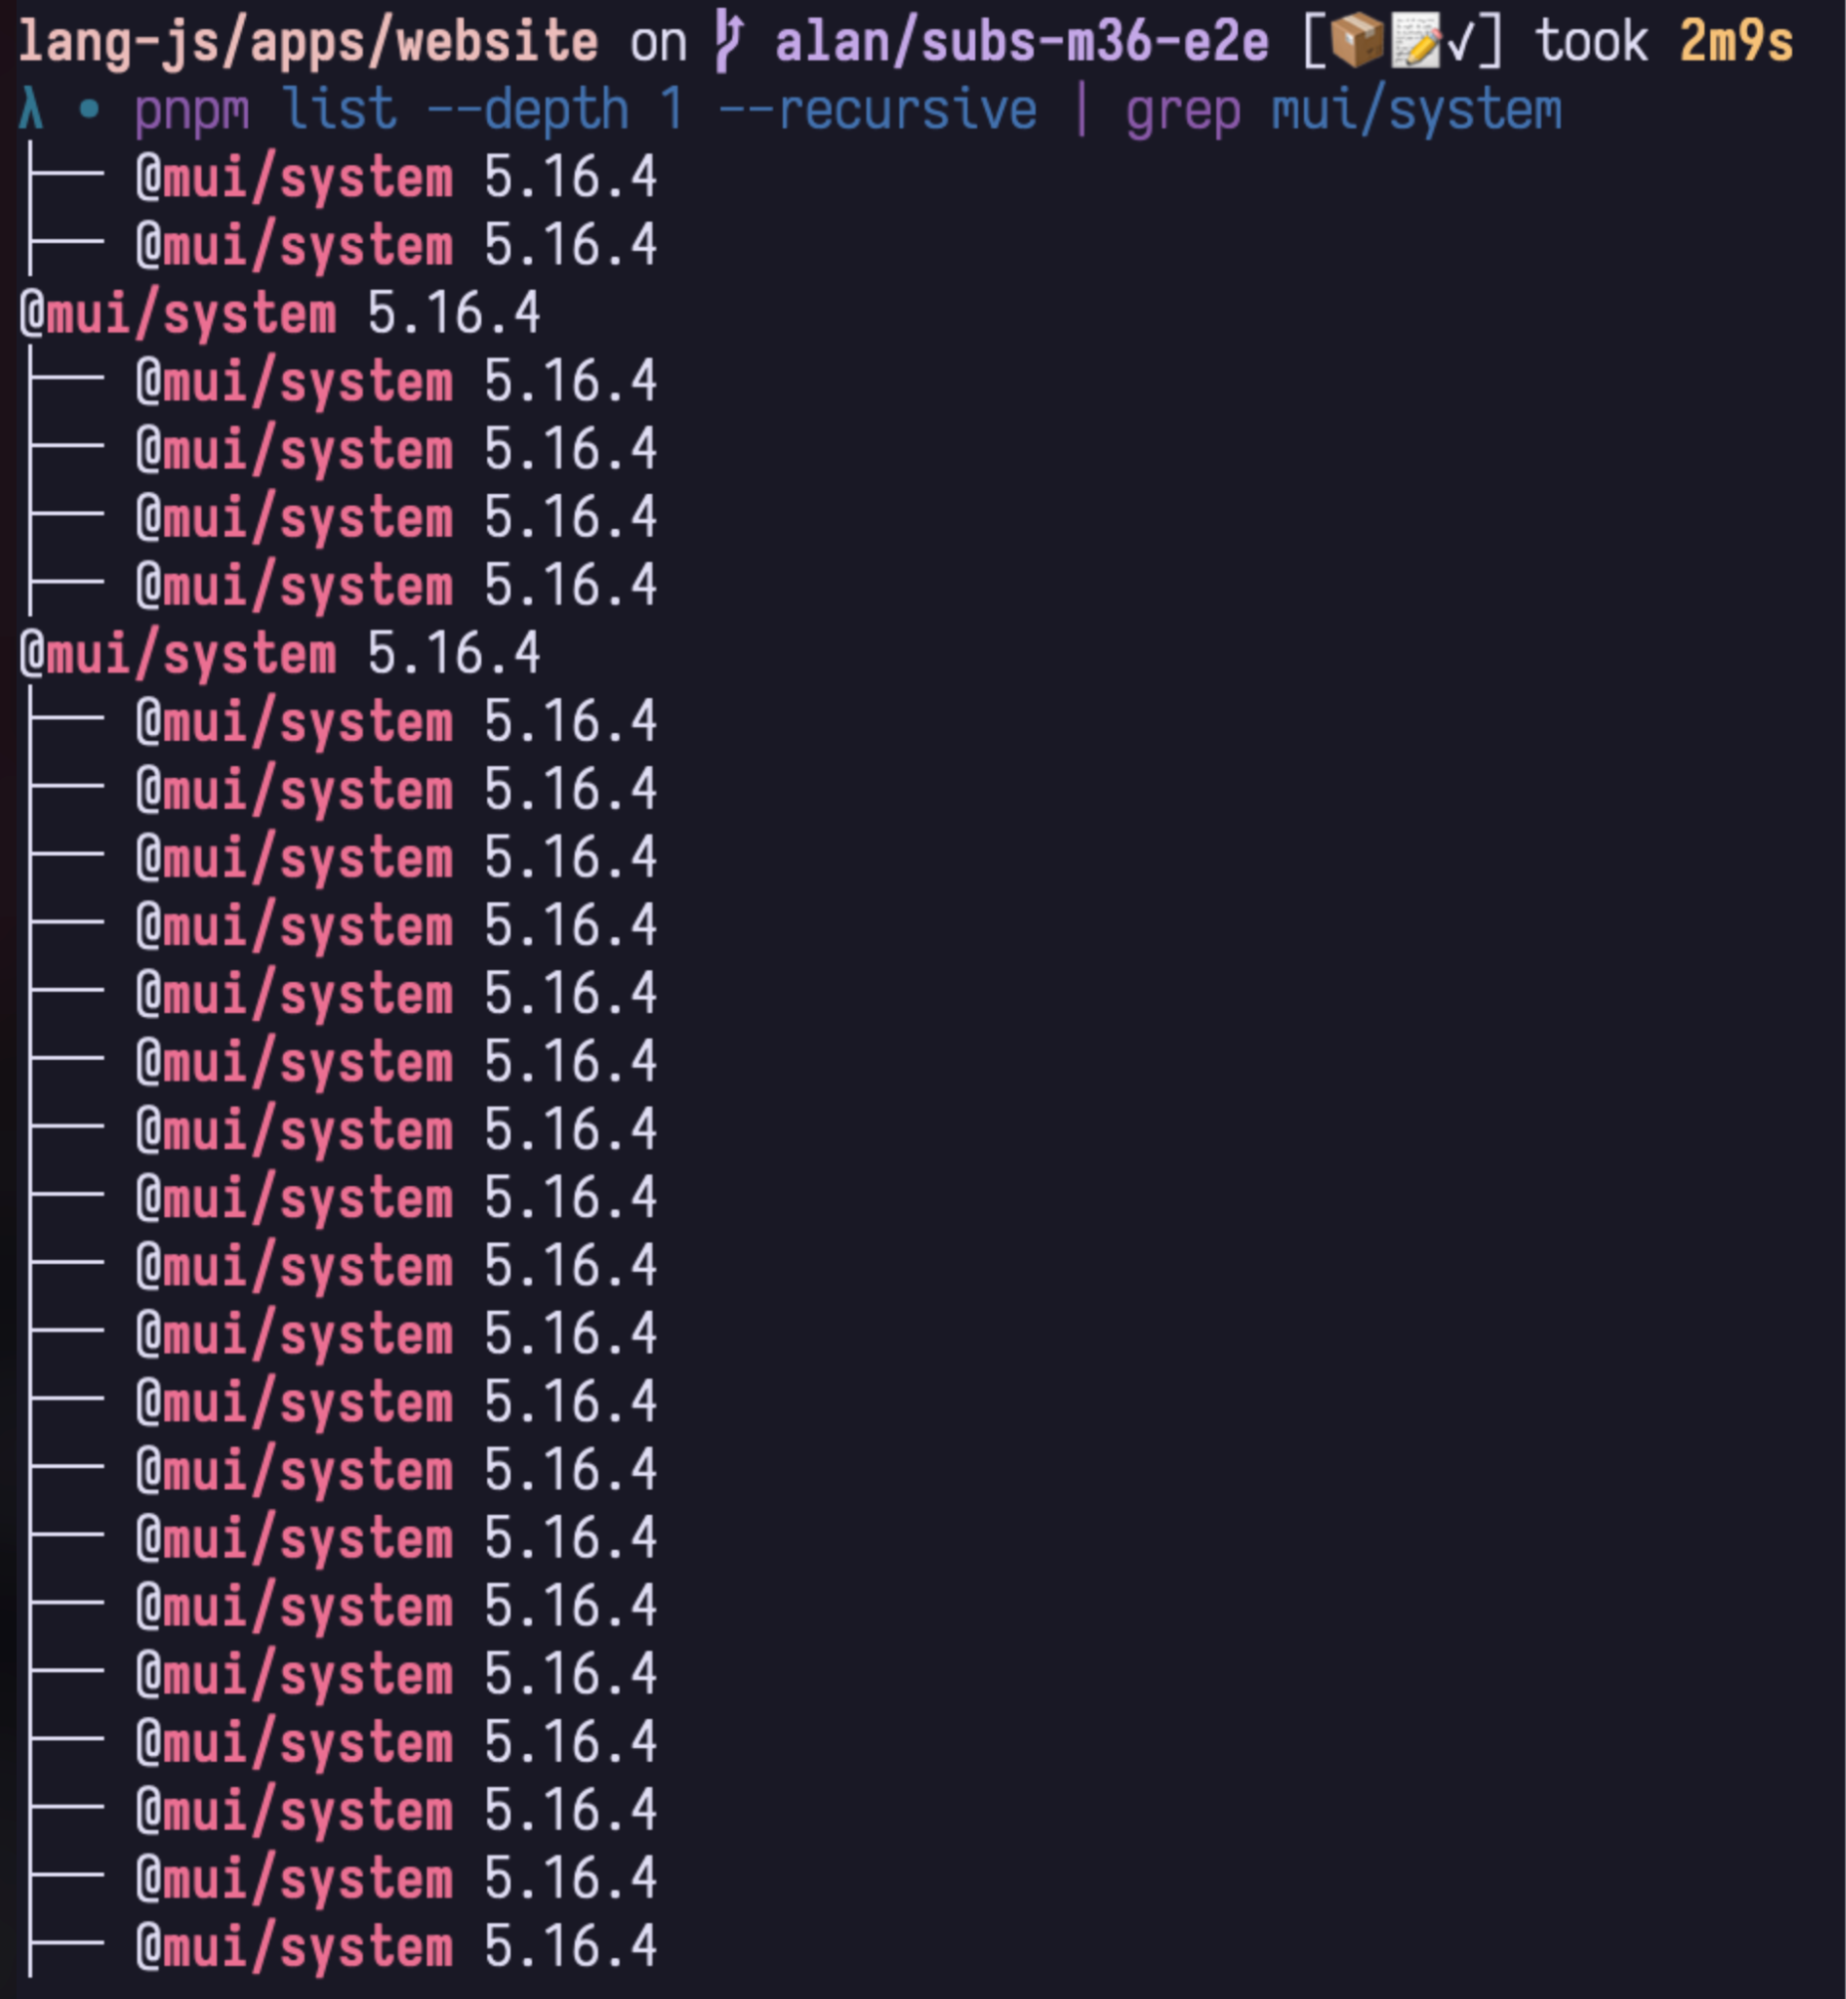
From here, I run pnpm install and verify alignment on the package version using pnpm list
The result
Here’s an example of the new trace, job duration in CI and compilation time in my personal machine. The new trace doesn’t have clumping blocks anymore, the CI job duration came back down to original levels, and my compilation time decreased to 30 seconds.


Understanding the cost of unions and intersections
Why would having a single duplicated type have such a tremendous impact in the compilation time?
To answer this question, we have to remember that typescript is a structural type system. In simple terms, that means that types are compatible with each other if they have the same structure. “If it quacks like a duck, and walks like a duck, it must be a duck” but applied to types.
Here’s an example that explains the process the compiler follows to type check a program.
For instance, to eliminate redundant members from a union, the elements have to be compared pairwise, which is quadratic. This sort of check might occur when intersecting large unions, where intersecting over each union member can result in enormous types that then need to be reduced.
The trace from earlier was attempting an intersection of the type SystemCssProperties which is a union of around 844 members. The result is 844^2 computations to resolve a simple intersection of the same type. This is just one instance, but there could be more.

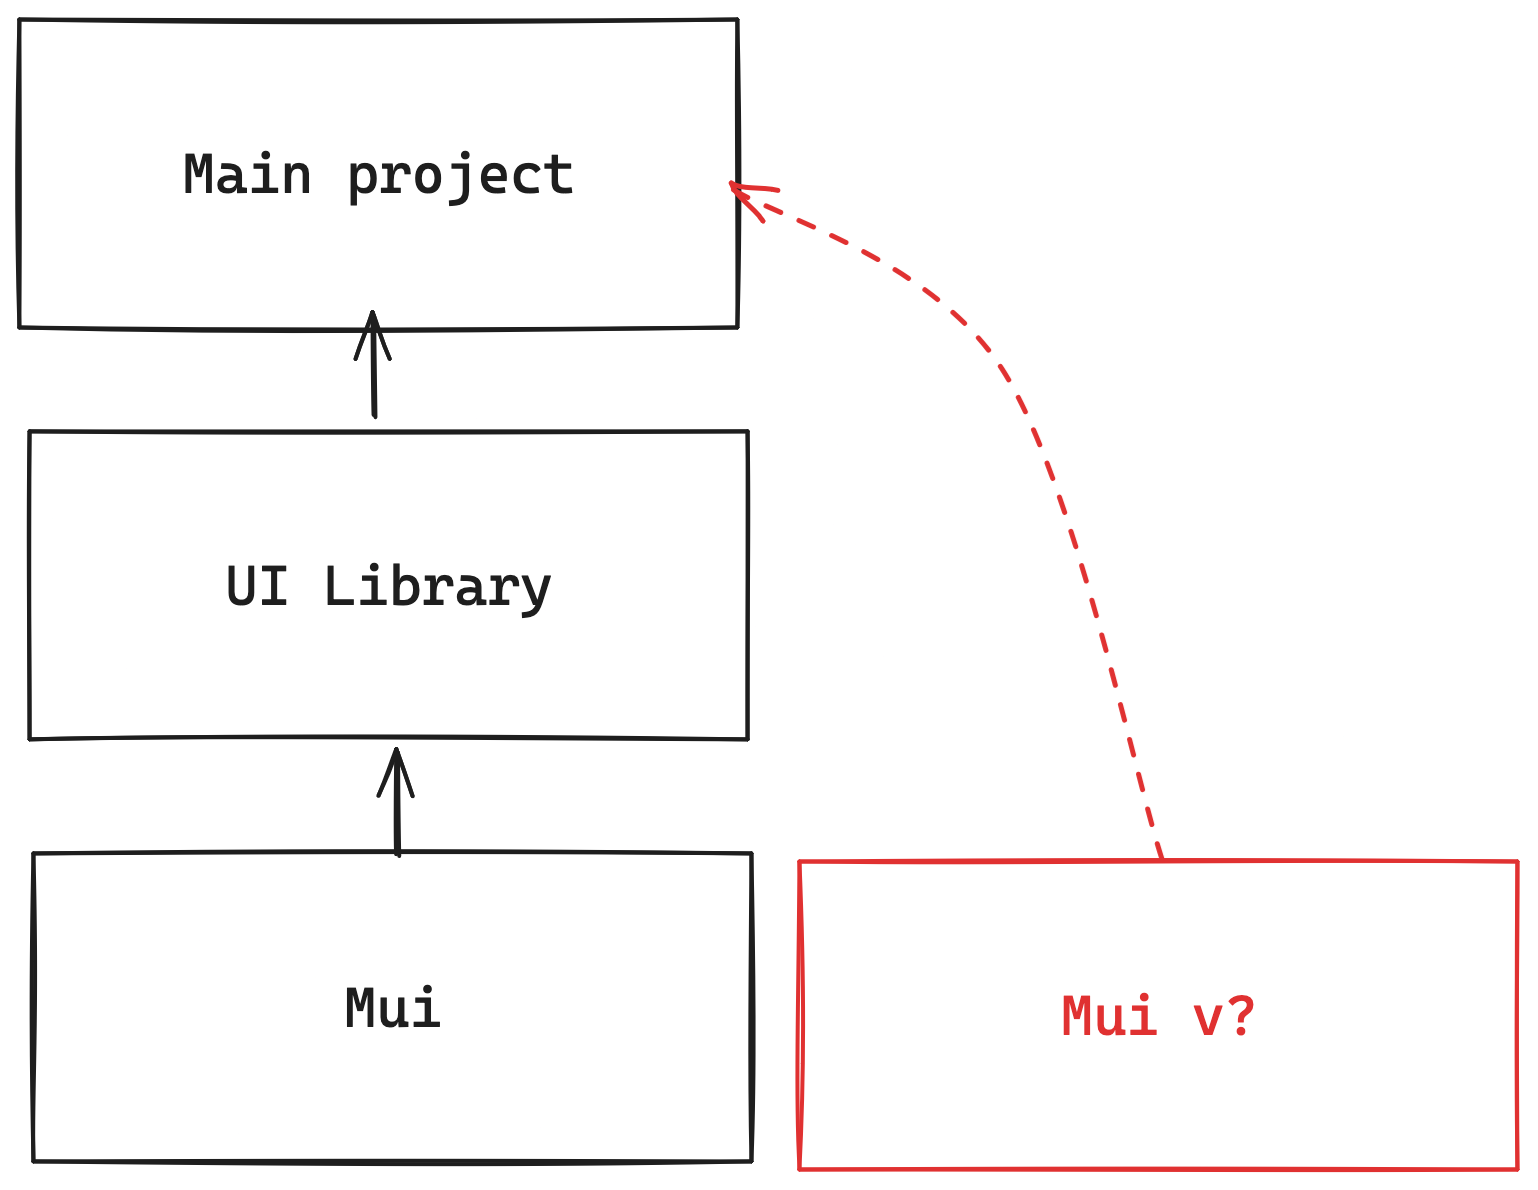
Understanding how was this bug introduced
Outschool has a UI library which in turn uses Mui. Normally, every UI element should come from this Outschool library. However, this time around, the main project imported new Mui libraries directly. This created two different dependency resolution paths which led to different versions of the same library in the same workspace.
All package managers have capabilities to constrain library versions on multiple resolution trees and they should be used when you have a use case like this.
An alternative approach is to lock a version on both projects to be exactly the same. This is more rigid and would make library upgrades a bit more difficult.
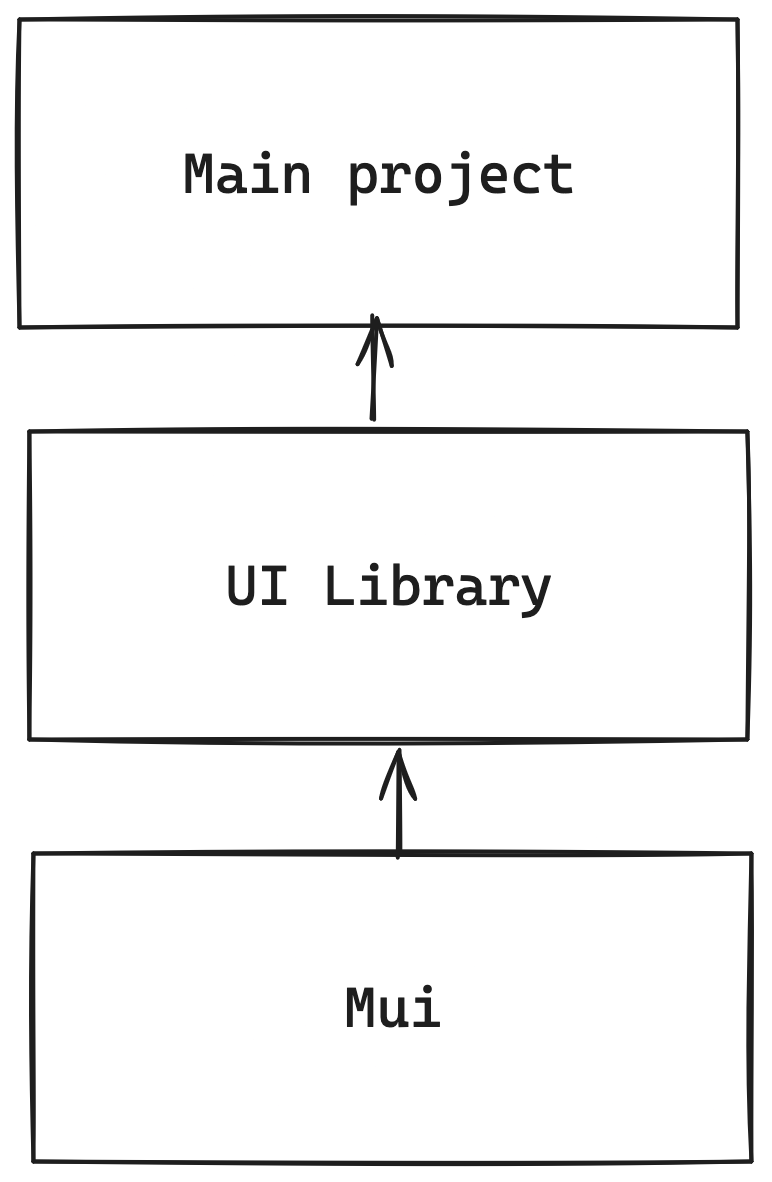
Arguably, the optimal path forward for this problem is to extend Outschool’s UI library in such a way that the main project doesn’t have to import anything from Mui itself. Simplifying the dependency resolution and improving library modularity.
Next steps
This was a relatively long process that could be shortened by the library typescript-analyze-trace. It provides an easy to digest output that presents hotspots in your compilation process. At the same time, it can detect common problems like multiple versions of the same package!
This is a companion tool that wouldn’t replace the visualization of compilation traces, but would definitely point you in the right direction sooner.
Conclusion
Having the same library with different versions on the same project can cause typescript compilation slowdowns caused by duplicated types. Specifically, big unions that are intersected represent a quadratic cost. It’s possible to trace down compilation problems using the tools provided by tsc in combination with trace analyzers like chrome or edge browsers. And as a complementary tool for daily usage, the library typescript-analyze-trace can point out obvious missteps.
About the Author

Alan Andrade Cestelos
Lead software engineer