

Gitlab Runner on Kubernetes
by Jimmy Berry
Outschool had been using Gitlab SaaS along with a self-hosted Gitlab Runner to fulfill our CI/CD imperative. As the sophistication of our efforts improved beyond the basics of a functional workflow that is performant enough for our team size we found ourselves interested in a wider range of functionality and metrics. When evaluating our options we distilled our goals as follows.
- Observability
- System level metrics for insight into the stability and capacity of the system
- Job level metrics to drive resource tuning and track performance degradation
- Direct access to logs and running containers to debug problems
- Optimization
- Support non-homogenous job resource requirements
- Control over provisioning on demand and tune with metrics
- Provide a high performance worker pool for critical, expensive jobs
- Integrate scheduled capacity, cluster-level caching
- Reliability
- Smooth upgrades and rollback without duplicating the worker pool
- Avoid docker-machine usage since no longer supported by Docker
- Standardize on container based deployment without host image management
The above was to be realized without disrupting the product development team. Like any production migration, everything must be backwards compatible, tested in advance, and require no downtime if possible. Product engineers are the infrastructure team’s customers.
Starting point
Our self-hosted runner was accomplished using a community made Terraform module that provides a docker-machine executor using EC2 instances. Through docker-machine the setup provided auto-scaled EC2 instances based on the CI job load along with an over-provisioning schedule.
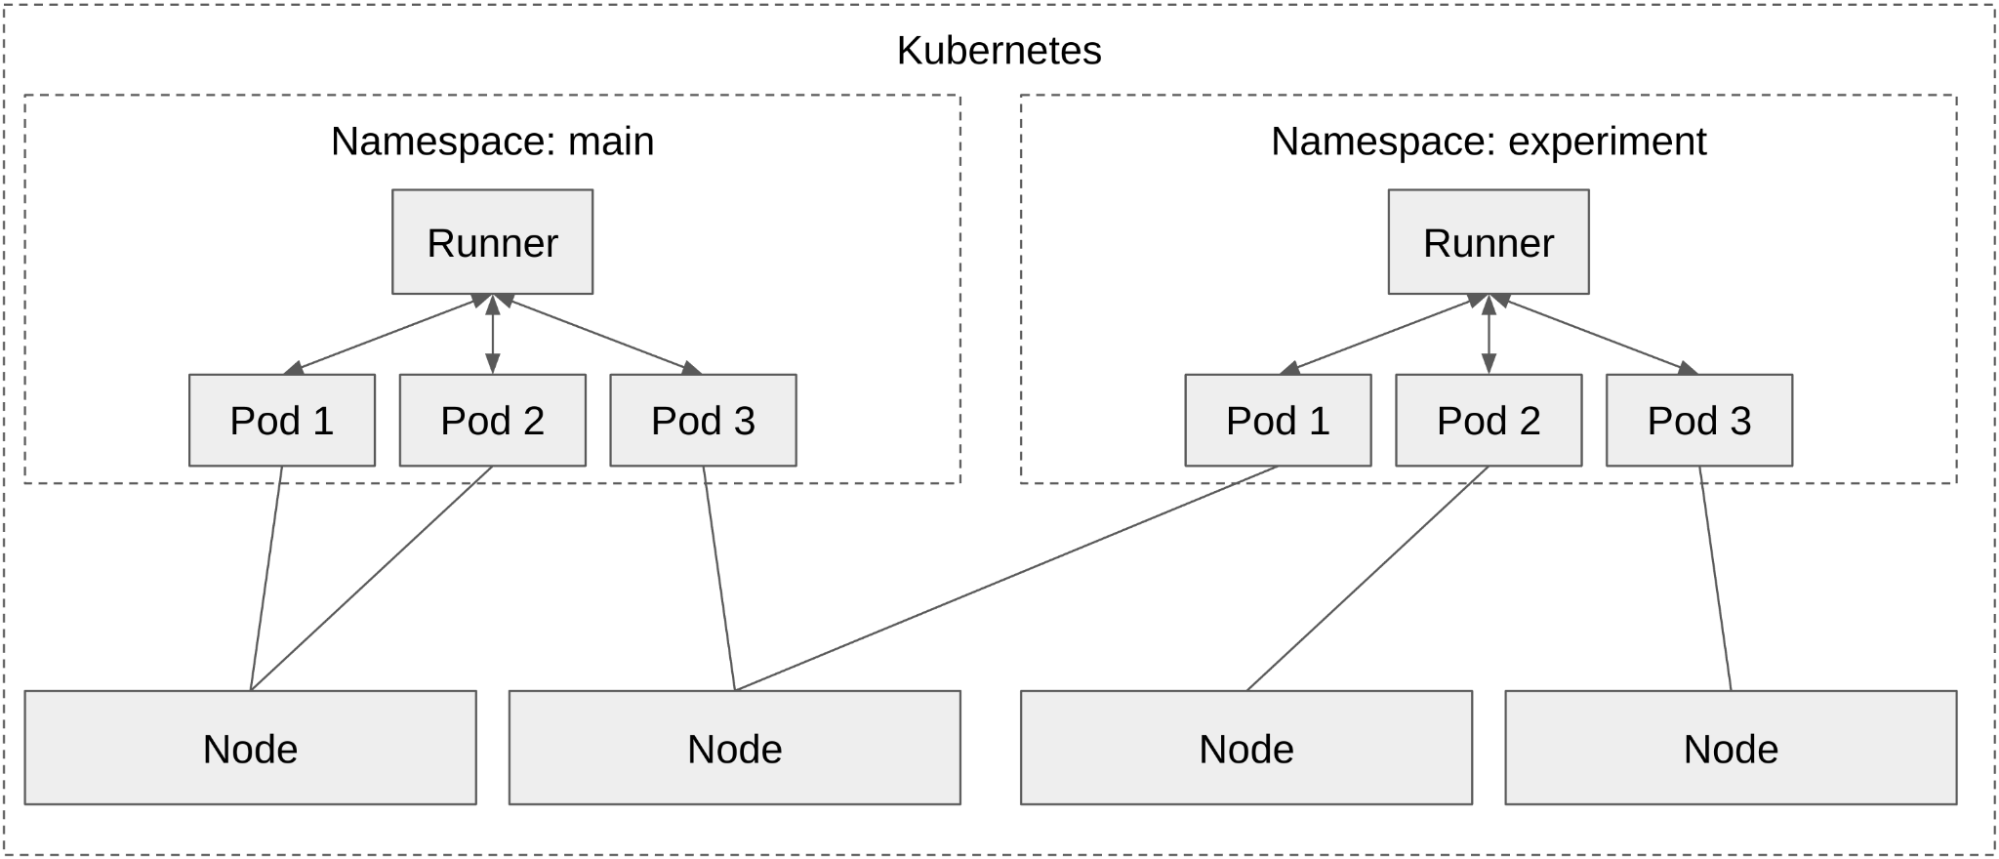
Our Terraform setup included both a production and experiment instance, enabled on-demand, that shared the same S3 cache bucket. When updating the Gitlab Runner, the experiment runner would be enabled with the newer version. CI jobs would be split between the two runners and eventually switched over to the experiment runner when things appeared to be stable. The production runner would then be updated and everything switched back over. Given the nature of docker-machine, each runner had a separate pool of EC2 instances. This meant that during upgrades jobs assigned to a newly enabled runner were likely to have a spin up delay in addition to being double provisioned as a system for the given load CI load.
Although we had some job level metrics, like success/failure rate, duration, and counts generated from Gitlab webhooks we did not have any resource utilization metrics beyond those provided by EC2. The EC2 metrics are also not correlated to specific CI jobs and are thus only useful to gauge the overall utilization of the system.
The following demonstrate some of our webhook generated metrics (stored in Honeycomb) for pipelines, jobs, and the duration of container build jobs by application.
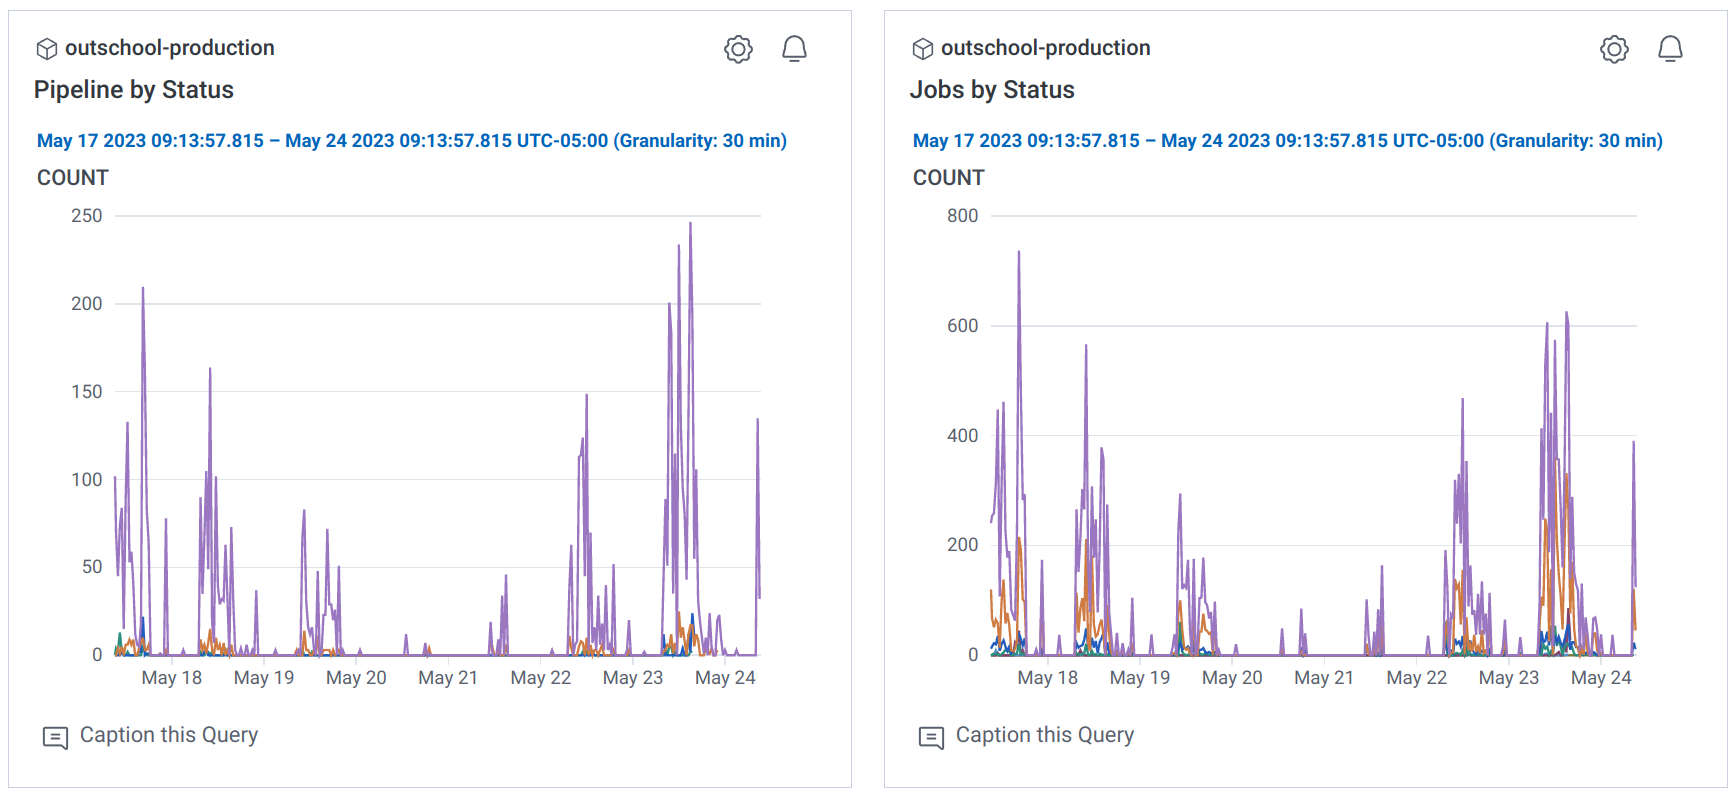
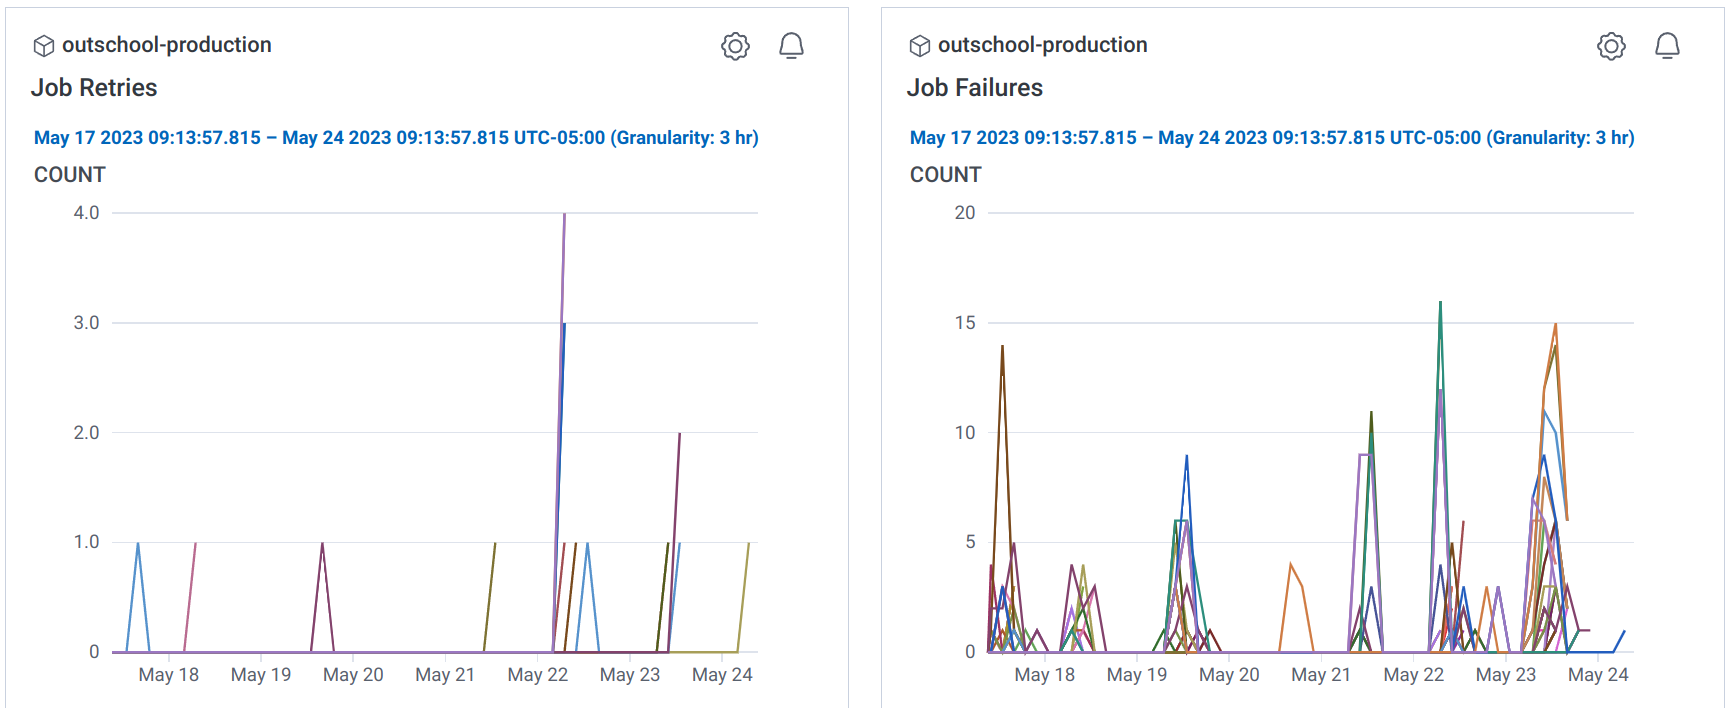
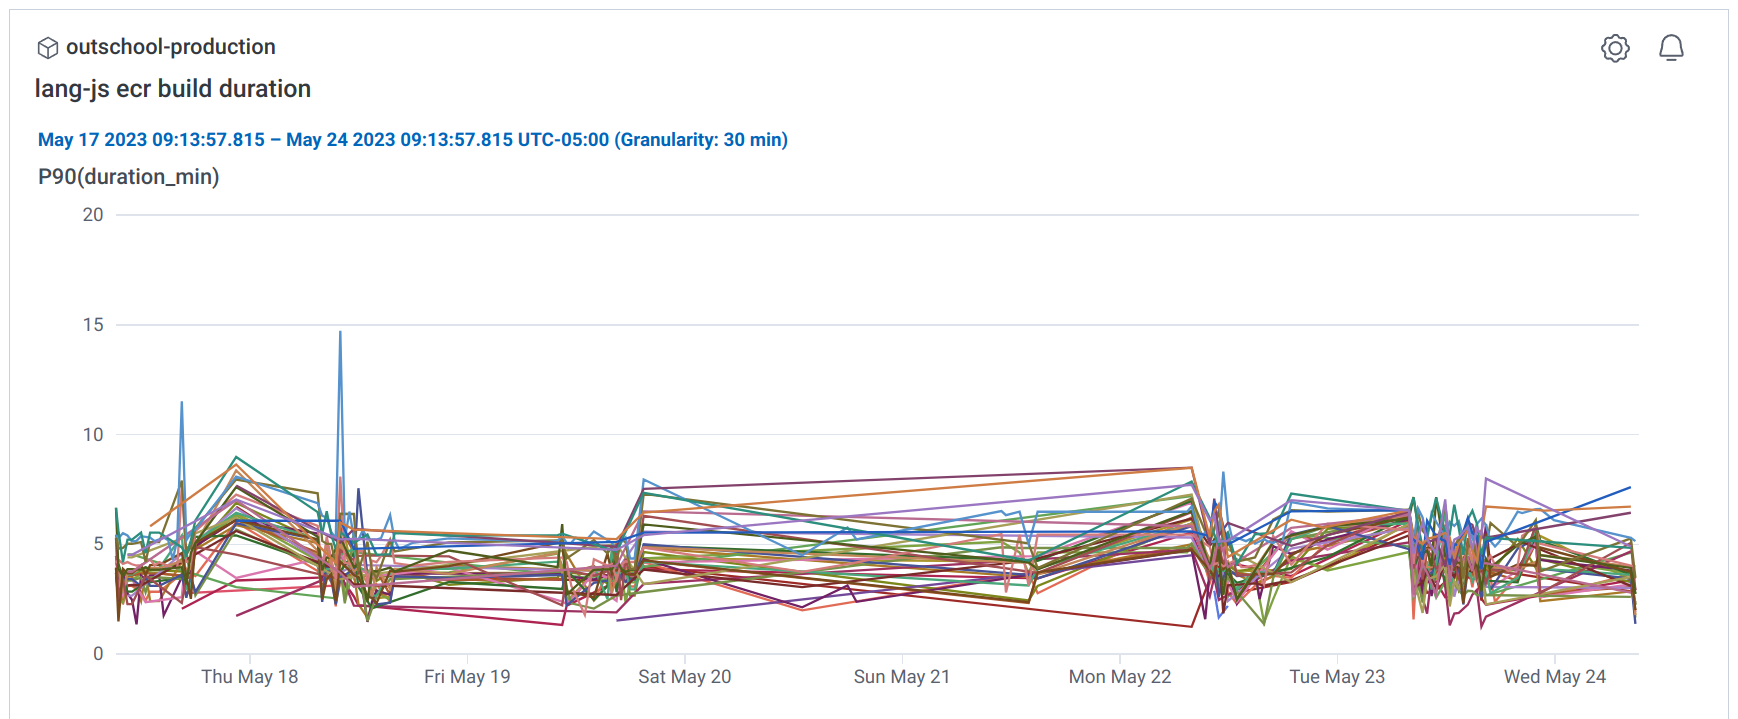
The metrics are useful for understanding what jobs are most common, and thus eating up most of CI, and potentially flaky jobs based on failure rates. Spikes in failure rates are very useful for spotting a regression in an update to the underlying CI system or even changes to the job definitions that cause wide-spread problems. To this end we have set up alarms on key metrics like failure rates in our merge train.
Kubernetes
Based on some initial research, reading through the Gitlab Runner documentation/issues, and discussions with our Gitlab representative, it seemed clear that the Kubernetes (k8s) executor had much of what we wanted. The direction appeared to have momentum and given the broader state of k8s it seemed like a good direction to move from the EOL docker-machine executor.
Executor
The Gitlab Runner has the abstraction of an executor which is responsible for providing an interface to an environment in which CI jobs can run. Simply put, the executor provides a shell-like interface that can execute a command and returns the output and exit code. The docker-machine executor relies on docker-machine to provision the underlying machine instance, in our case EC2, and to communicate with those instances to start a container and run commands within it. By contrast the k8s executor simply creates pods within a k8s cluster and attaches to them to execute commands and read the result.
By separating the machine instance provisioning from the Gitlab Runner setup itself this allows for a shared node pool along with the added flexibility provided by the k8s scheduler. Our experiment setup described above is now capable of sharing the same set of nodes without the need to double provision.
Non-homogenous jobs
Similarly, non-homogenous jobs are supported by passing resource requirements through to the k8s pod where the scheduler handles them. Whereas with docker-machine only the number of jobs allowed per instance could be controlled, with the k8s executor the size of the jobs can also be varied.
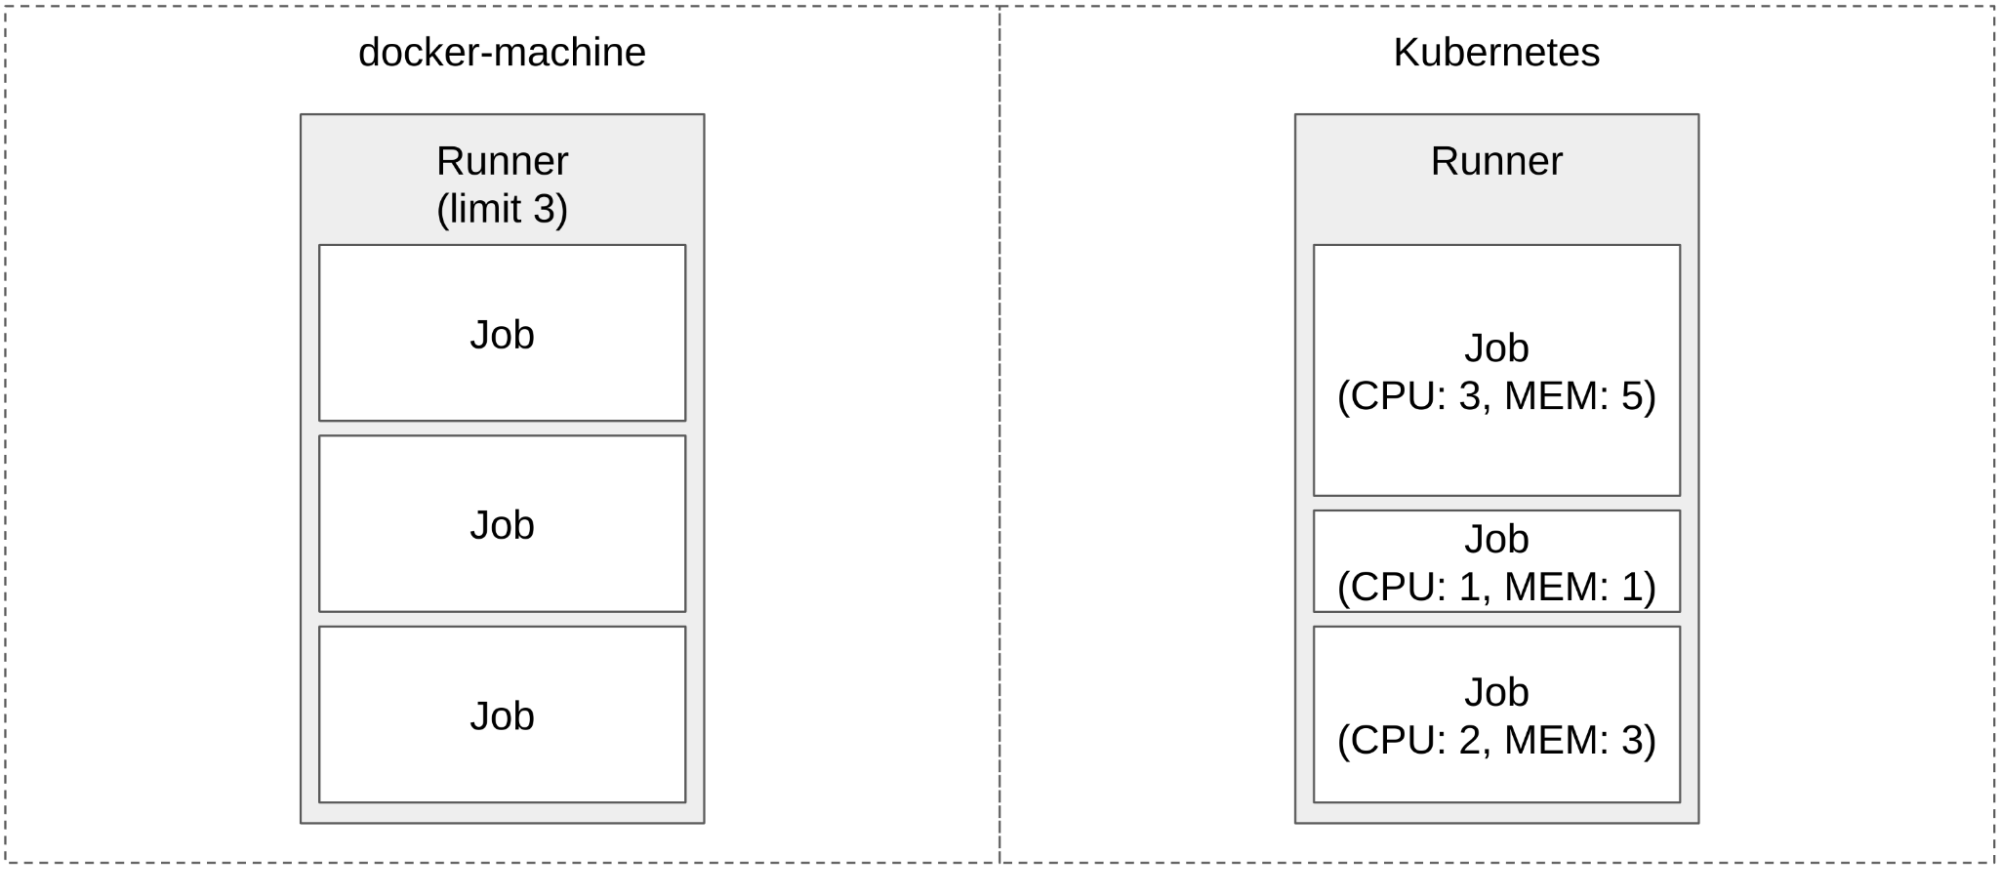
This is very useful for efficiently utilizing machine resources since CI jobs vary dramatically. From deployment jobs that are mostly calling APIs and waiting for completion to building and testing jobs that can take advantage of high levels of concurrency and expansive CPU and memory power.
Our deployment jobs went from taking up a whole machine instance just like our build jobs (8 cores and 10 GiB of memory) to only requiring 1/4th of a core and 500 MiB of memory. Effectively, we can run 20 deployment jobs with the same resources as a single application build job. So instead of requiring 20 machines, 20 deploys only require 1 machine.
Non-homogenous jobs can be accomplished to some extent by having multiple Gitlab Runners with different underlying instance sizes consuming different sets of job tags. This is far less flexible since the jobs within those tags still need to be homogenous while the k8s solution will schedule a variety of job sizes within the same node pool.
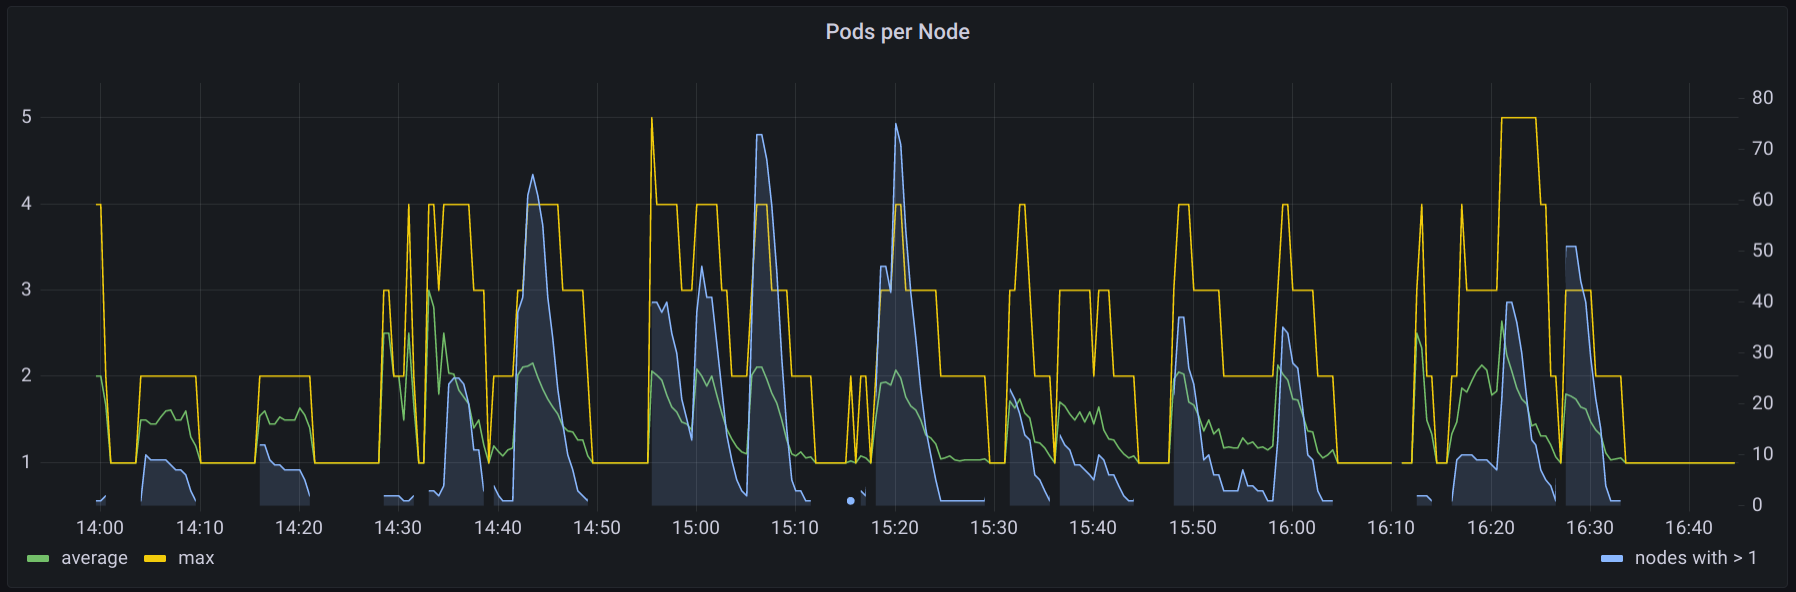
An example from a couple hours in our CI cluster shows multiple jobs running per node. The nodes we are using are still the same size as before we switched to k8s so the jobs per node are not generally overly high, but the average is consistent.
Separate Node Pools
Along the same lines, different machine classes (like higher CPU clock speed instances) can be selected for specific jobs using node selectors defined by individual CI jobs. Non-homogenous jobs are still scheduled properly within these special node selectors. For our purposes we have cpu=fast and cpu=normal where the fast pool is used by some of our heavy application builds where the cost trade-off is worth the developer experience improvement.
Utilizing the fast CPU pool we were able to reduce the longest duration jobs that dictate our merge train speed and thus increased our overall deployment capacity. Again this could have been achieved using tags and separate runners, but this requires one runner for every desired combination. To support just two job sizes on both CPU pools would require four runners. Given we have dozens of job sizes either we would end up with the overhead of many runners and configuration pairs or less efficient resource utilization. With the k8s executor we do not have to sacrifice either since the k8s scheduler handles the complexity.
Autoscaling
In order to provide a sufficient number of nodes to process our CI load we utilize the k8s cluster autoscaler deployed via a Terraform module. The cluster autoscaler takes care of starting and stopping EC2 instances in order to run all of the pods (CI jobs) within the cluster. The k8s autoscaler handles summing the resource requirements of the running and pending CI jobs and boots or terminates machines accordingly.
Over-provisioning
The load on a CI system tends to be volatile since pipelines can create many jobs at once and pipelines may be created rapidly during iteration and even bulked together due to events such as large engineering meetings ending. In order to make a best-effort to run jobs in a timely fashion, over-provisioning is key. Without it, spikes will always be blocked waiting for new instances to start up.
The generally accepted method of over-provisioning a k8s cluster is to create a deployment of pause containers, containers that sleep indefinitely, with resource requirements equivalent to the amount of over-provisioning desired. For example, if 20 medium and 10 large instances are desired then 30 pause containers would be created. 20 of the containers would have resource requirements needed to fill a medium instance and 10 would have requirements sized for a large instance. The cluster autoscaler will then provision nodes for the pods.
The final piece to the puzzle is scheduling priority. By marking the over-provisioning pods as the lowest priority they are evicted when high priority pods need to be scheduled. If the cluster is at full capacity with 30 extra instances and a new CI job comes in, a pause container will be evicted and the CI job scheduled on the node that was freed. The cluster autoscaler will then provision a new node for the evicted pause container.
Effectively a buffer of machines is created that can be consumed by spikes of incoming jobs with a window to replenish equal to the length of time required for the cluster autoscaler to request new machines and those machines to be added to the cluster. During that window if CI jobs complete and free a node the pause containers may be scheduled there leaving a free node when it eventually joins the cluster.
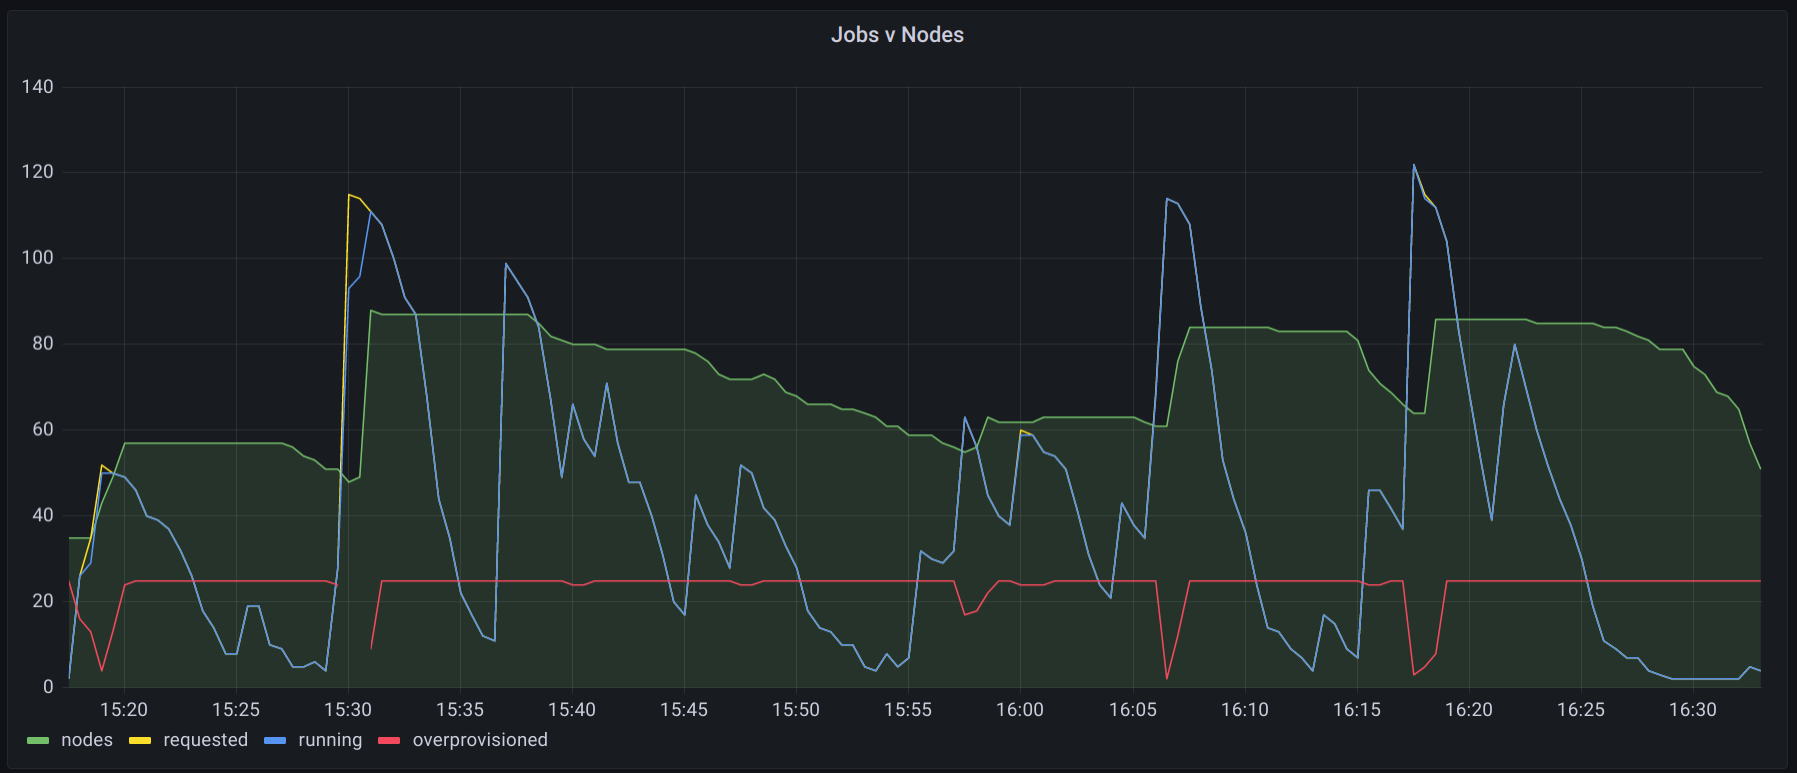
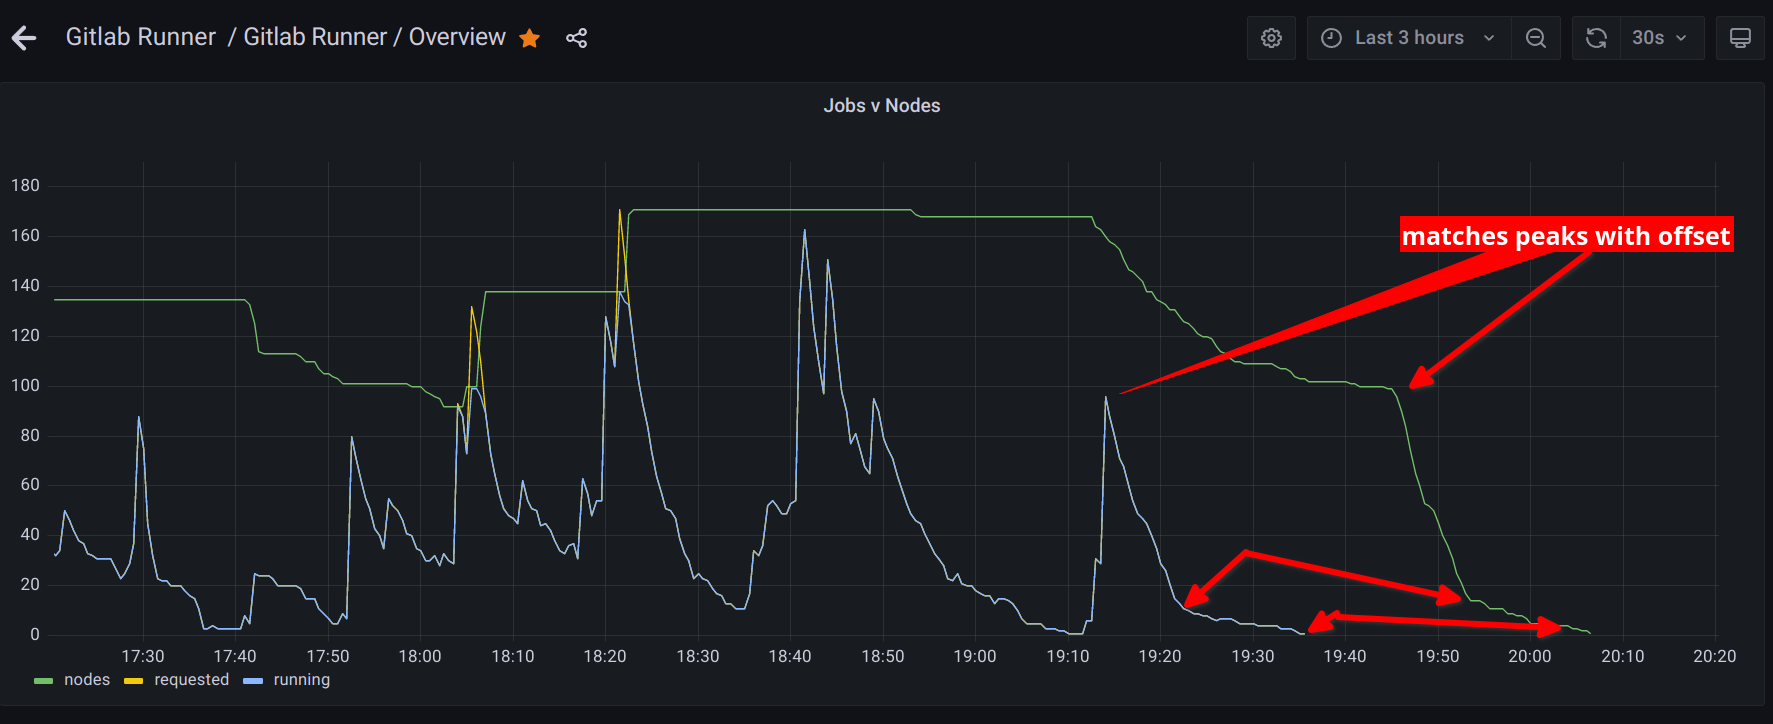
The following is an example of our CI system under low to moderate load where the over-provisioning buffer is exhausted once while being utilized several other times.
Since we have fast and normal speed CPU node pools we can also break down the load by pool to see if we need to adjust over-provisioning.
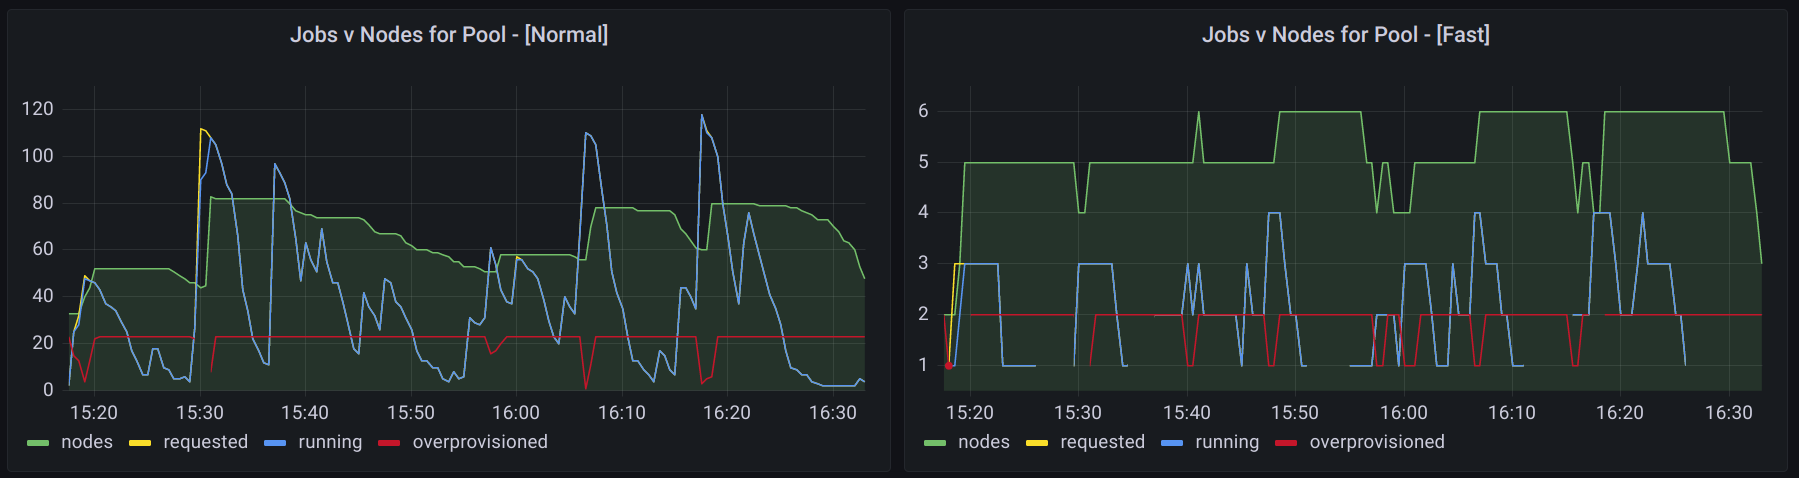
Using this information we have been able to effectively tune our buffer after changes to team size, CI job efficiency, and periodic load.
Our over-provisioning deployments are sized on a schedule using the kube-schedule-scaler which allows us to configure the amount of over-provisioning based on the time of day/week to mirror our distributed team’s work hours and provide an appropriately sized cluster. We considered other options such as proportional and metric based scaling, but both options would ultimately end up being just as reactionary as the cluster autoscaler since the CI load cannot be predicted in advance and there is no fudge factor like a web service response time. We even explored AWS auto-scaling group warm pools, but those do not work with launch templates which we use to customize disk size.
Ultimately, the instrument used to manage the over-provisioning is a deployment which makes it trivial to increase or decrease our over-provisioning manually to handle one-off needs. Integrating the schedule based scaling with a vacation calendar would be a rather nifty next step.
Caching
Since CI load tends to be very spiky it makes sense for auto-scaling to cull nodes quickly, but this results in a high likelihood of nodes being fresh and lacking caches. Even if the caches are common to many jobs, a job has a good chance of being scheduled on a fresh node or one fresh to that job type. As such, the more aggressive the rate of downscaling and the spikier the CI load the more common a cache miss occurs.
Because of the tendency for nodes to lack caches, a two layered approach is used. A cluster level cache avoids reaching out to remote sources while a node level cache optimizes performance on warm nodes. The two layered caching approach reduces external bandwidth transfer while also improving the performance and reliability of accessing cached data. Caching data common to all jobs improves the overall efficiency of the CI cluster while also reducing developer wait time for jobs to start and thus complete.
Git Repository
The project repository was mirrored via a ssh server deployment that clones the repository daily. When the first job runs on a node, the cluster repository cache is rsync’d to the node from where it is used as a reference repository for each subsequent job. Since the repository head does not change that substantially over a day this approach drastically reduces the reliance on the remote repository.
The net result was a 30-60 second savings on each job when a node cache was available and over 30s savings on the initial clone from the cluster cache. Results will be heavily impacted by the repository size. For some of our critical pipelines containing sequential jobs the net wall-clock savings was around 2-3 minutes.
Container Registry
In order to avoid Dockerhub rate limits we utilized the Gitlab Dependency Proxy. All of our CI-only images were hosted on a private Gitlab container registry with the remaining production images hosted on ECR. Our suspicion was that we were far exceeding our upstream transfer limits and that we could improve job startup time by providing an in-cluster proxy.
We ended up replacing the Gitlab Dependency Proxy entirely with a self hosted registry. An additional registry was configured to act as a pull-through proxy for the Gitlab private registry. All pushes remained direct to Gitlab and ECR respectively.
While there was a 20-50% performance improvement to image setup time, the primary bottleneck, assuming quality connectivity, is decompression and extraction rather than transfer. The reliability problems we had been encountering essentially disappeared after switching to the internal registry cache since the number of requests to the upstream source was drastically reduced and replaced by in-cluster requests.
Transfer
After deploying both the git repository cache and container registry caches we measured the daily transfer rates to our internal proxies at between 1-2TB. In our case the transfer amount is split nearly evenly between the git repository cache and the container registries.
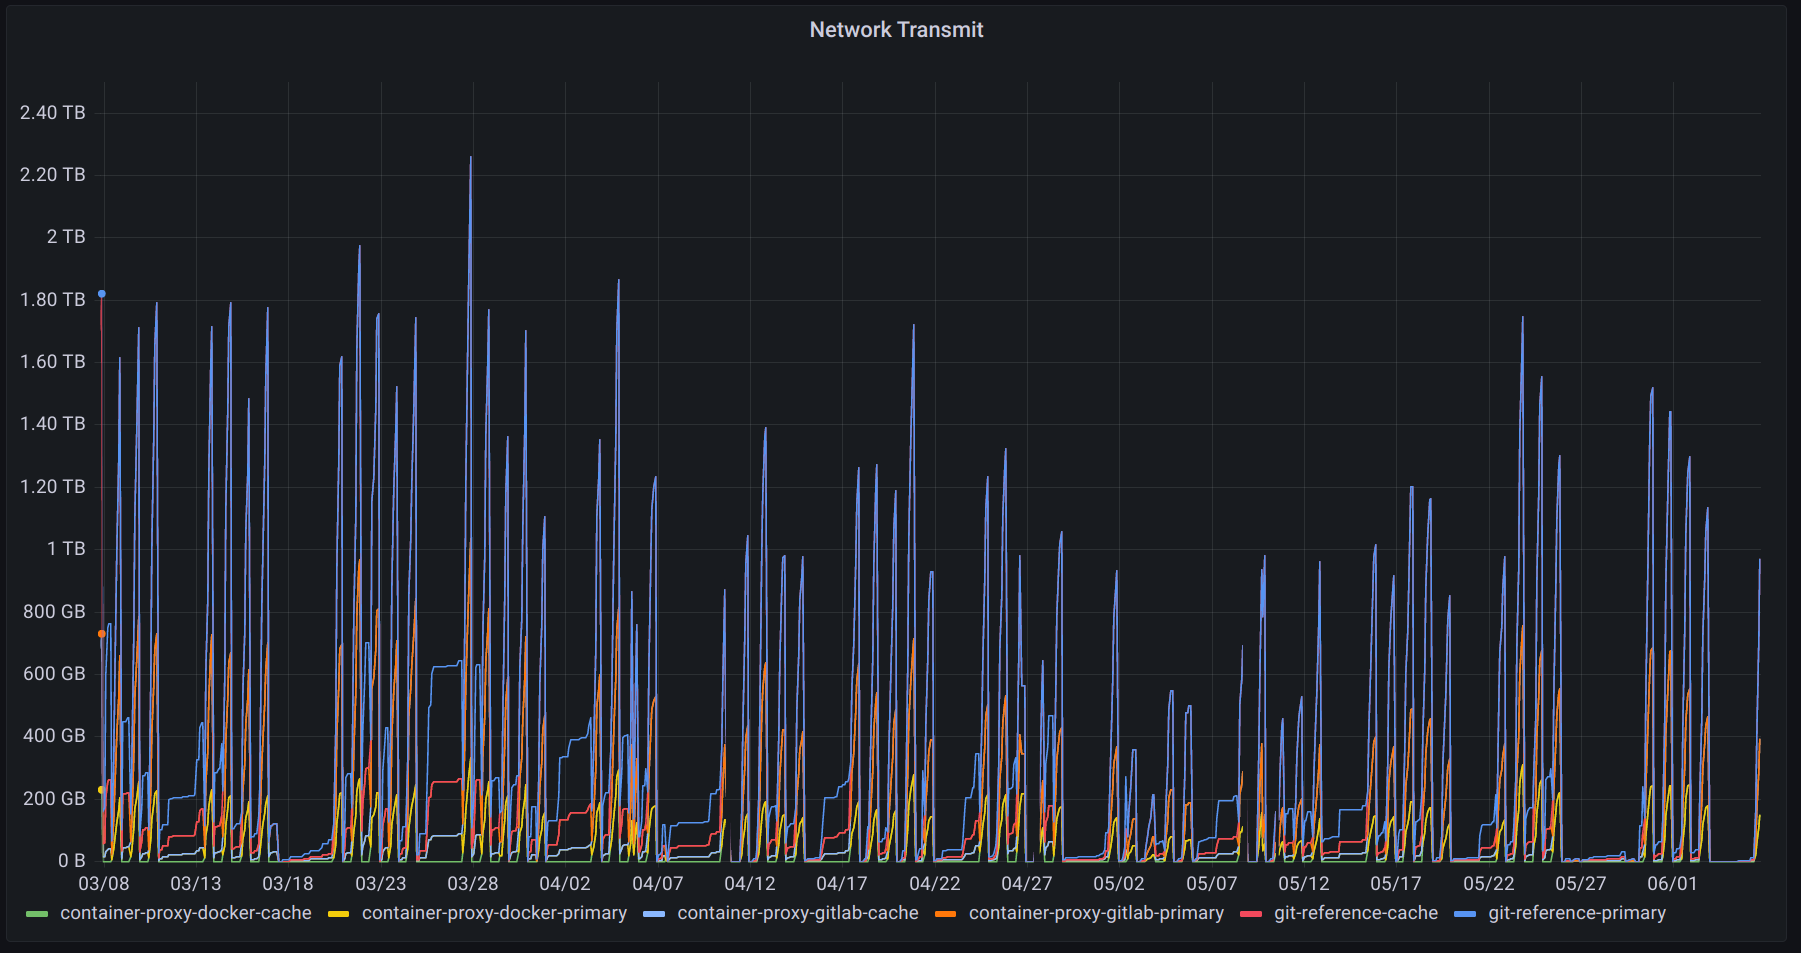
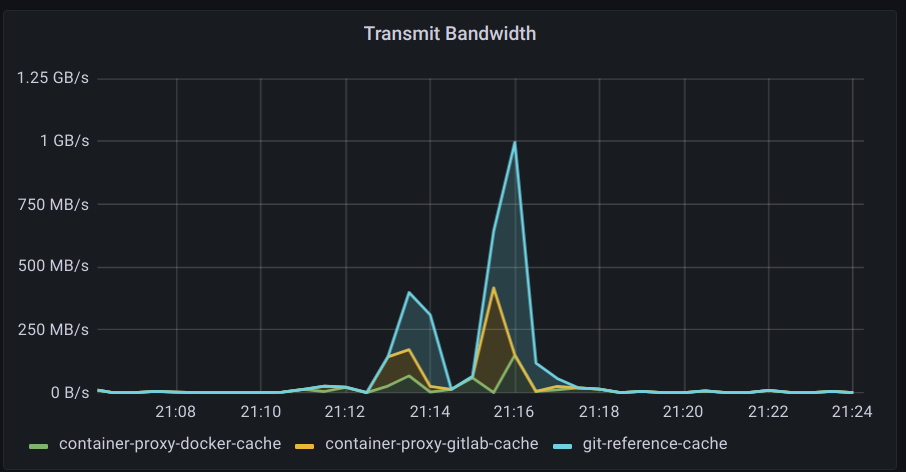
During peak usage and spikes it was observed that the caches saturated their network links while not exhausting the relatively small amount of CPU they were given.
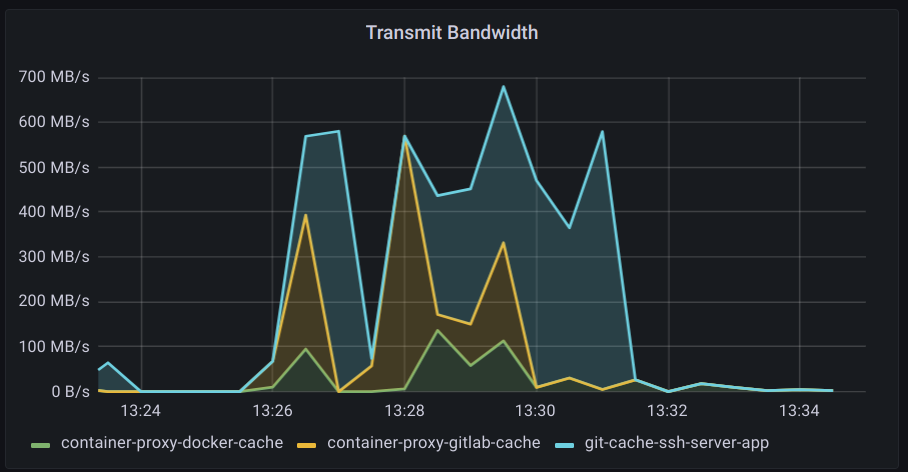
The cache deployments were switched to a node pool with 12.5 Gigabit links which allowed for a more complete utilization of CPU. Traffic patterns tended to be even spiker rather than a flat top as seen when saturating the network link.
The git repository ssh server still exhausted CPU more aggressively than the container registries, but after switching to ed25519 keys the utilization was more efficient. As anticipated, cloning the git repository (many small files) is more CPU intensive than transferring large container image layer blobs.
Since the caches are completely independent the replica count can be adjusted as needed for future team growth.
Upgrades
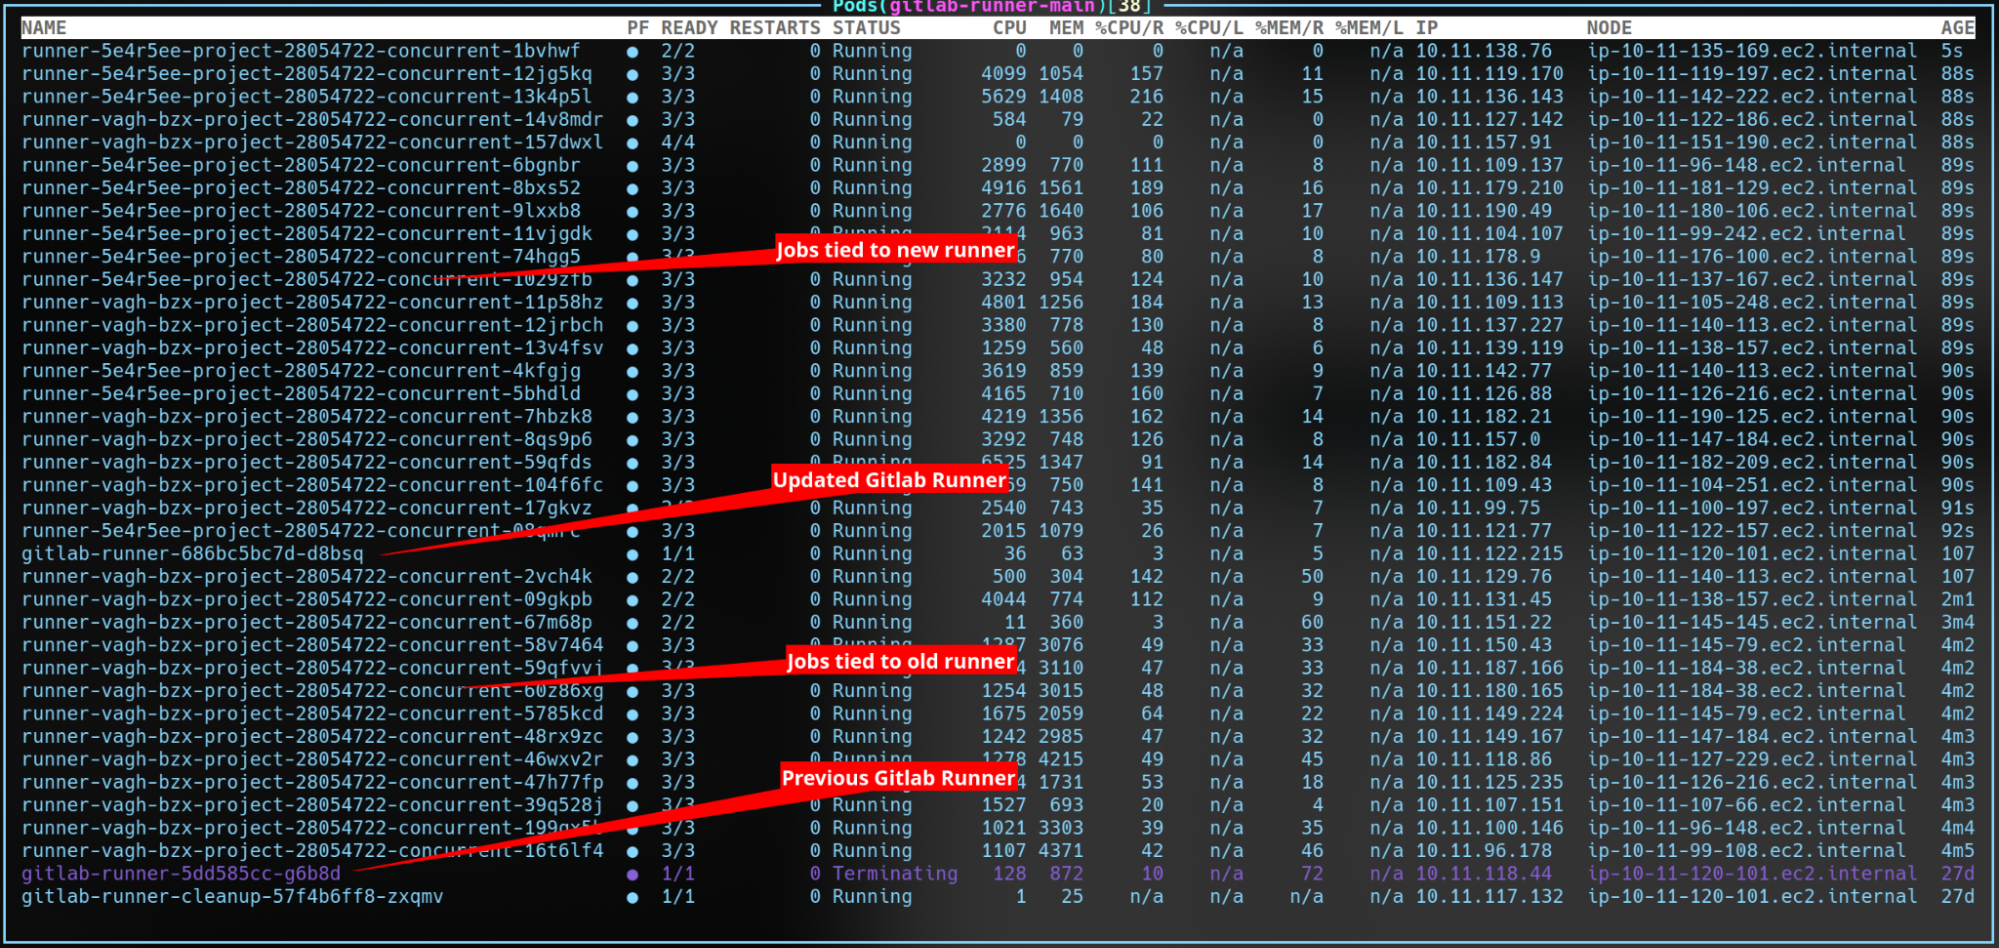
The Gitlab Runner is defined as a k8s deployment via the upstream Helm chart. When making configuration changes or upgrading the runner version the deployment creates a new pod and waits for it to become healthy. Once the new pod is healthy the old one enters the terminating state. Since the Gitlab Runner is only considered healthy once it is able to consume jobs, the old runner stops accepting jobs when given the signal to terminate. The old runner will remain until all the jobs it accepted have completed since it is responsible for them (streaming logs, reporting results, and executing commands in the pod).
Updates can be performed in-place and can be clearly monitored by sorting the pods within the Gitlab Runner namespace by age. Once the pods between the two deployments complete the terminating pod will be destroyed. This also works for multiple updates in a row before the previous terminating pod has terminated.
For risky upgrades/changes they can be tested in another namespace/cluster with different runner tags to pull testing jobs. For stable, but long-term experiments we can run an experiment runner in the main cluster.
Observability
One of the attractive aspects of k8s was the extensive ecosystem around monitoring and tooling (ex. k9s) that can be applied to our CI workloads. This ecosystem enabled us to achieve our observability goals without having to build things from scratch.
Metrics
As may be clear from the above screenshots, our k8s setup is instrumented to provide a wide range of metrics which have enabled the detection of a variety of problems and areas for improvement. After some experimentation and research, we decided to deploy Prometheus with node exporters for collection and storage, paired with Grafana for visualization.
There are two main challenges with metrics for CI workloads: 1) the general need for an agent on the machine to extract more intricate system metrics, and 2) the need to associate the metrics to a specific CI job. General CPU utilization and even some disk throughput can be tracked without agents within the VM, but for process specific metrics an agent is needed. Association with a CI job requires the metadata from the Gitlab Runner to be exposed to the metrics system.
The first problem was solved using the Prometheus node exporter which runs on each node and has access to detailed system level information. The second problem was solved by exposing the relevant job level metadata as k8s pod labels (see pod_labels and pod_labels_overwrite_allowed) and configuring Prometheus to scrape them. The Gitlab Runner has since added a variety of annotations that overlap with some of our labels. Once all is said and done, the CPU metrics for a particular CI job on a specific branch can be queried!
We have a number of custom labels that are added pertaining to our CI setup which are included in the following example.
(
  node_namespace_pod_container:container_cpu_usage_seconds_total:sum_irate{
    namespace="gitlab-runner-main",container="build"
  } / on (namespace, pod) kube_pod_container_resource_requests{
    namespace="gitlab-runner-main", resource="cpu", container="build"
  }
) * on (namespace, pod) group_right kube_pod_labels{
  label_outschool_dev_ci_commit_branch="$ciCommitBranch",
  label_outschool_dev_ci_path=~"$ciPath",
  label_outschool_dev_ci_job_name=~"$ciJobName"
}
The result is a graph of CPU usage for the selected branch, app, and job.
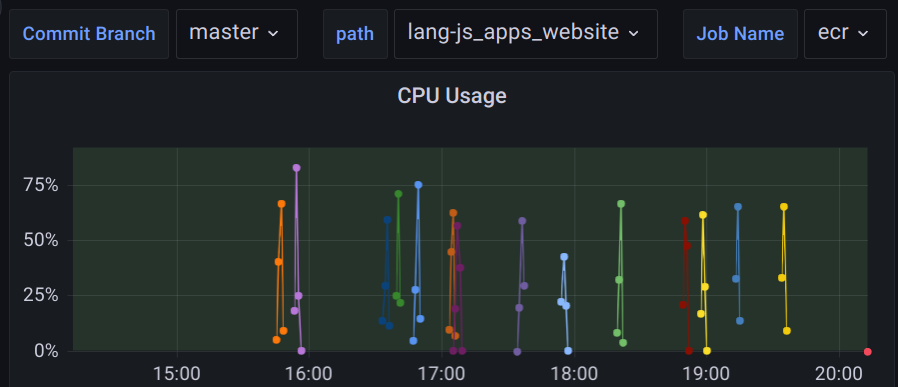
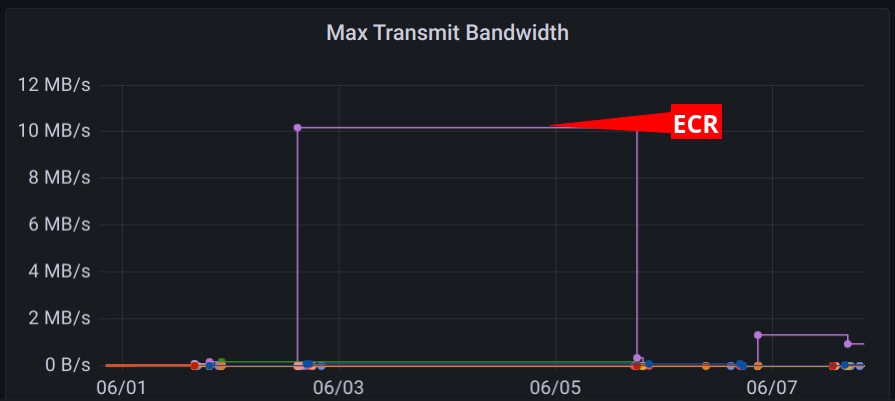
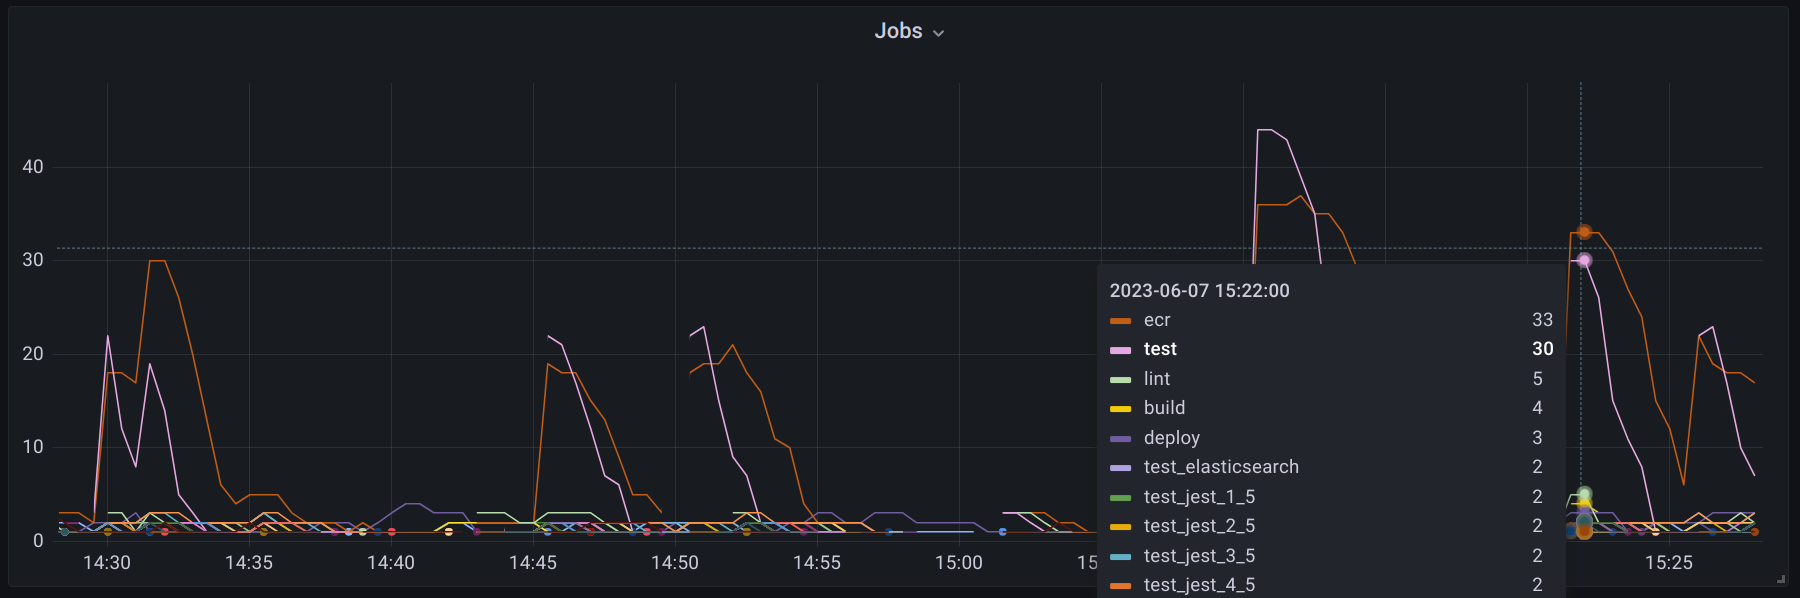
All sorts of metrics and filters can be combined to provide a dashboard for individual job runs, comparisons across all runs for a given job or even all jobs. Using overview graphs it is easy to identify jobs that utilize a particular resource more than others. For example, the ECR job transfers at a higher rate than any other job in our main application pipeline.
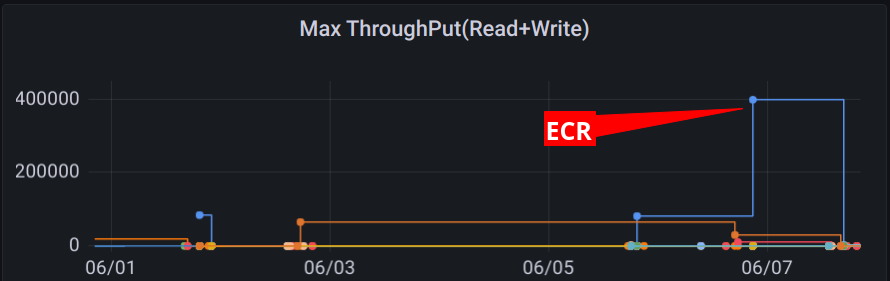
The ECR job also heavily utilizes the disk which makes it a good candidate for faster disk instances.
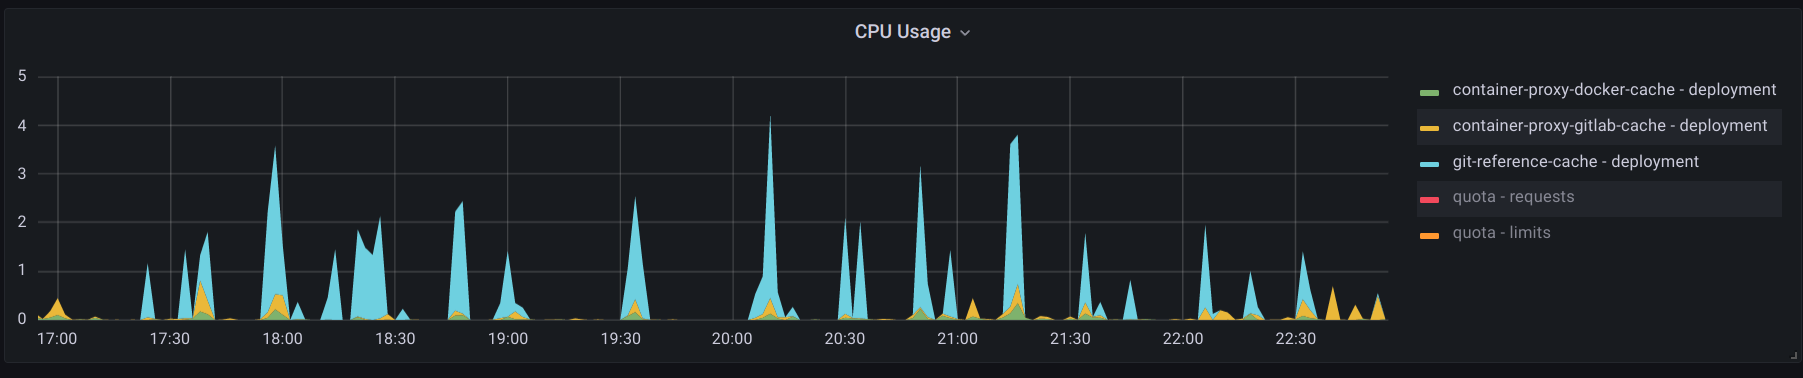
Trends and regressions in resource utilization can also be detected when the period is expanded for one job across the primary branch. The resource requests/limits can also be graphed along-side the usage to optimize resource utilization. Even the counts of jobs by name can be useful to understand what are the most prevalent jobs that should be prioritized for optimization and improvement.
The k8s labels and annotations provide an effective interface for sharing Gitlab Runner metadata with the monitoring system. Such systems are already accustomed to using this interface for tracking metrics by application and other user-defined attributes. The Gitlab Runner supports setting k8s labels and annotations from within a job definition which makes for a flexible metadata workflow.
Debugging
Besides the metrics which provide a lot of insight into the overall health of the CI system, it can be useful to directly interact with the underlying system running a job. There is no substitute for seeing the full pod definition of a job, helper and service container logs, and attaching a shell.
From a job log in the Gitlab web interface the specific pod that corresponds to the job can be seen.
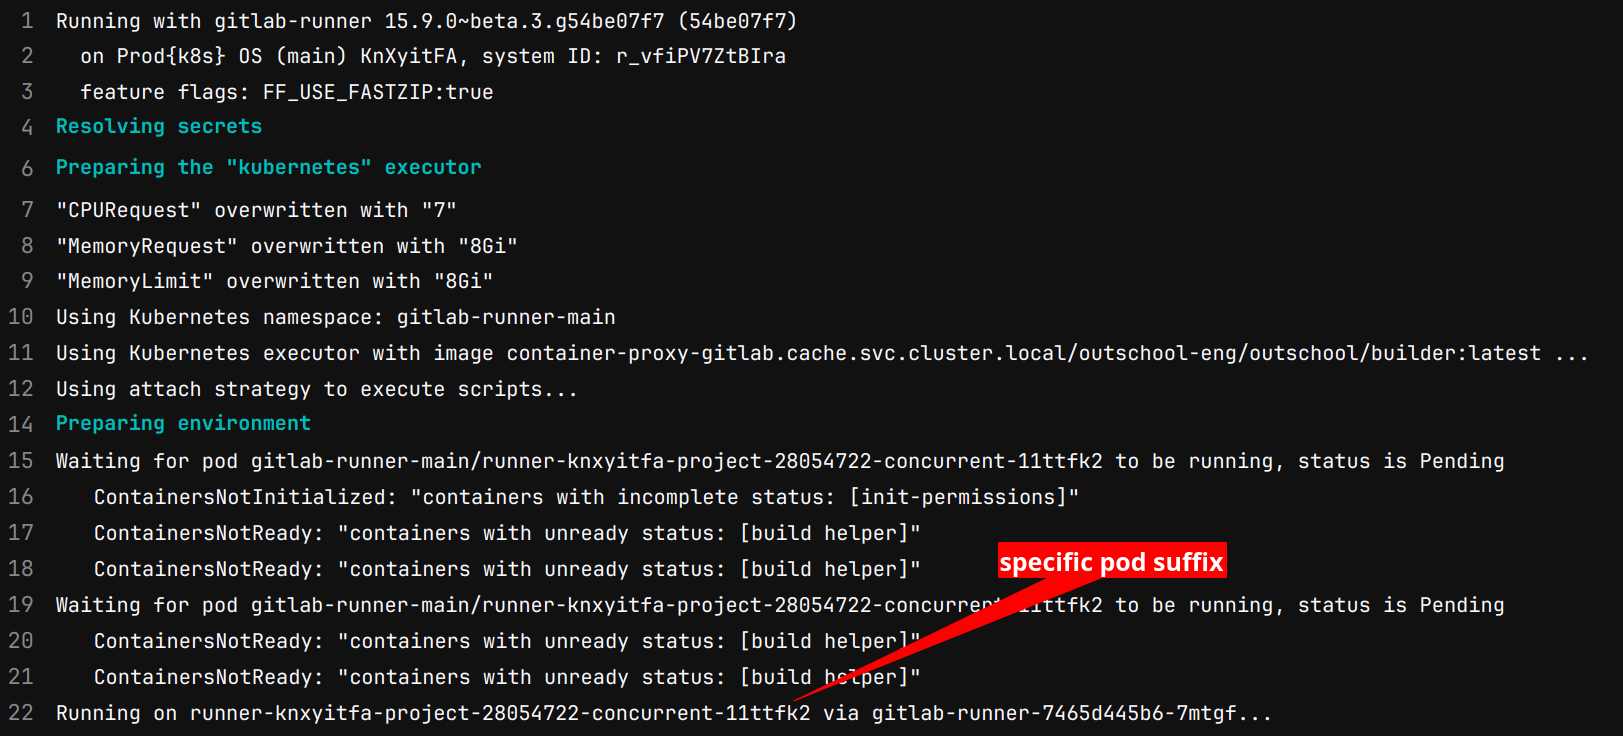
All that is needed is the unique suffix to filter to the appropriate pod in k8s. Using k9s the following will demonstrate filtering to a k8s pod and describing it.

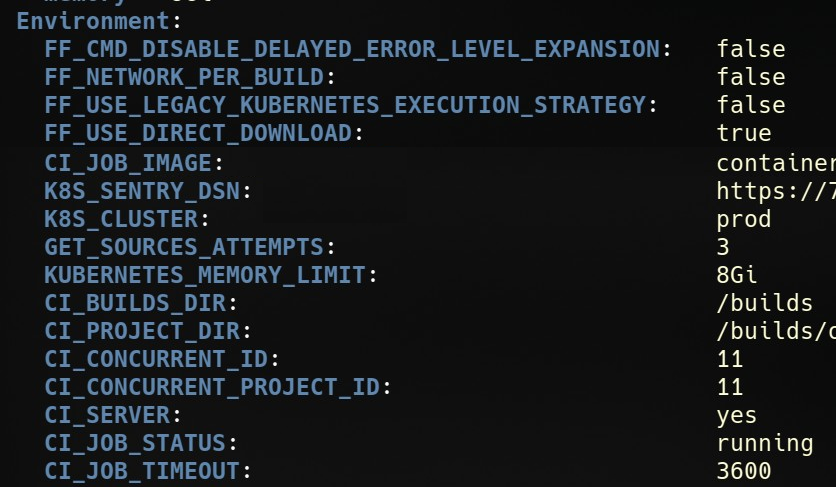
From there the pod can be described to see the expanded value of all variables, resource information, how long the pod took to schedule and startup, etc.
Pods also have annotations defined by the runner to tie the pod back to the job. This is useful if a pod gets stuck or is identified as using lots of resources to see what merge request it is associated with (going the other direction).
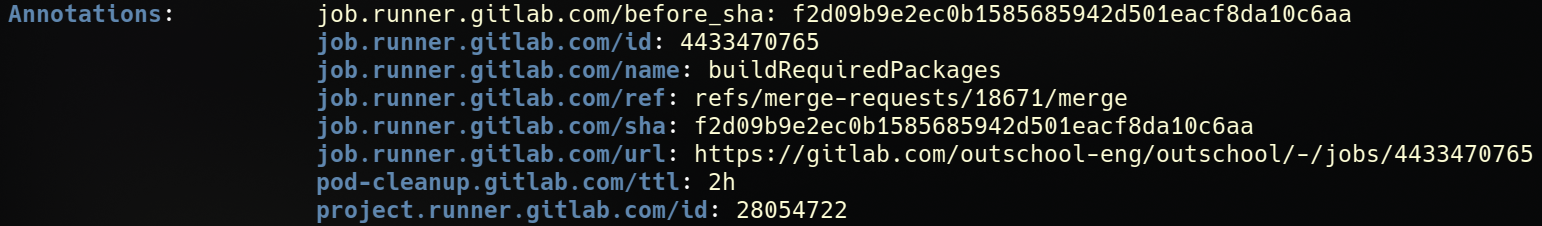
The full URL is available to view the job in Gitlab which has links to the containing pipeline and associated merge request.
Attaching a shell and viewing logs works as expected since the job is an ordinary k8s pod. Interactive web terminals are simple to enable using the Runner Helm chart. The web terminals allow a job owner to click debug in the web view to be taken to an interactive terminal running in the primary job container.
The ease of jumping between the k8s cluster and Gitlab is very powerful for tracking down problems and quickly getting to the source of an issue.
Migration
During the development and testing phase of the migration we had development k8s clusters for each engineer working on the project. The separate clusters allowed for experimenting with the underlying k8s setup in addition to the Gitlab Runner configuration. For many features changes need to be made at both layers and thus necessitated separate clusters to avoid disruption.
Each developer had open merge requests with the job tags changed to ensure their pipeline would run in their cluster. This allowed for testing fixed pipeline definitions repeatedly while being able to rebase at a controlled interval. Since the pipelines were run out of the target project, all configuration and related workflow was the same without any impact on the pipelines not intended for the test clusters.
The runner cache bucket was configured to be shared between both the old docker-machine and new k8s runners. This allowed for jobs from a given pipeline to be run on either system in any combination while having access to the same caches to ensure consistency. Sharing the bucket also ensured no noticeable degradation during the switch to the new runner nor would one occur during a rollback.
A production cluster was created for the integrated changes. The final switch required deploying the production k8s runner with a configuration to consume the standard tag used for our CI jobs. The jobs were then split between the new and old runner. After an evaluation period, the old runner was paused which effectively transitioned the entire CI load to the new runner.
The migration was completely transparent to the rest of engineering aside from our announcement that we were doing so. No downtime was needed and due to extensive testing no rollback was needed. There were a number of k8s specific features we wanted to utilize, but for the purposes of the migration we avoided them. We have continued to use the developer clusters for further refinement and to test both runner and k8s upgrades.
Challenges
We encountered a variety of challenges along the road to realizing the Gitlab Runner on k8s. Some are mentioned above, some are too long/dull to describe in this post, but some are reasonably interesting enough to include here.
Availability Zone Rebalancing
When using a single available zone for our worker node pools we were not able to reliably scale up. Expanding to multiple AZs resolved the capacity issues, but introduced intermittent job failures. Job logs would abruptly end with a message indicating the pod could not be found. The problem was eventually tracked down by noticing two trends in one of our graphs.
Even when using a 30 minute cull period the cluster would take substantially longer to scale down after the last job.
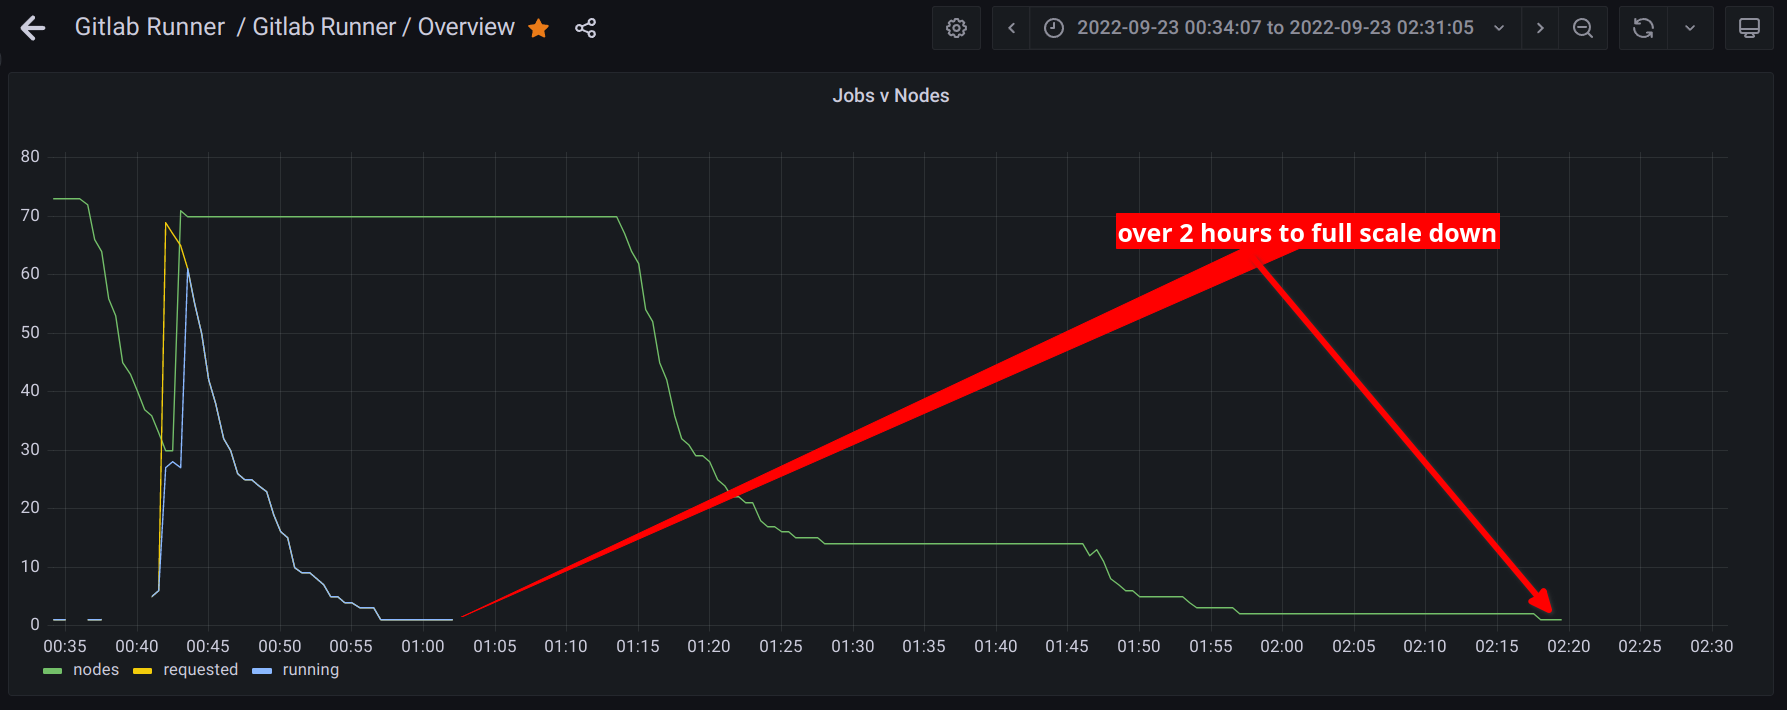
Additionally, when zoomed in the graph would appear to show a momentary increase in the node count by one and immediately back down by one (can be seen just after 01:45 above). After some investigation it was determined to be due to the auto-scaling group, zone rebalancing. AWS was trying to keep the machine counts similar by zone. During scale down an imbalance could occur that would be corrected by starting a machine in another zone and terminating one from the over-provisioned zone.
Terminating an instance, when done by the auto-scaling group, did not allow for the pods on the node to finish. This was the underlying cause of the “pod not found” error since the runner could not complete the job, but it would suddenly disappear. If there were no jobs running on the rebalanced node the “pod not found” error would not occur which made it less consistent.
Disabling zone auto-rebalance resolved the issue. In our case, rebalancing is completely useless since we scale to zero daily. Since CI jobs are not like services that can be migrated to a new instance the rebalancing is very disruptive.
Gitlab Runner k8s Auto-scaling Bug
Fairly regularly, we saw jobs fail to start with the following error.
ERROR: Job failed (system failure): prepare environment: error dialing backend: dial timeout. Check https://docs.gitlab.com/runner/shells/index.html#shell-profile-loading for more information
Based on observations it seemed to occur during scale-up periods, especially rapid scaling. After some digging the root cause was determined to be a difference in the behavior of k8s vs the expectation of the Gitlab Runner. K8s considers a node to be scheduleable before the certificate signing request (CSR) for that node has been completed. In the case of the Gitlab Runner a job pod would be scheduled on a fresh node, the runner would attempt to attach to the pod and fail due to a TLS verification error.
The problem was consistently reproducible. When testing with 300 jobs on an empty cluster a consistent rate of failure above 50% was observed.
The solution was to wait for the node CSR to complete and thus the pod would be attachable. Unfortunately, upstream decided to expand the network retry logic to treat it as an intermittent failure instead of the state which it is. For general use, the difference can result in slower job startup time, but should be stable although the timeout is combined with the general retry timeout. Either way, the problem was resolved by patching our runner and we will continue to utilize the state based solution.
Out of Memory Detection
Since one of the goals was to improve resource utilization we ended up tuning the resources requested by all jobs. In order to be as consistent as possible all jobs memory request and limit were set to the same value. Unlike CPU usage, which can be throttled, memory is either available or not. Since the conditions on a node will vary, depending on the other jobs running, using the same values for the memory request and limit helps ensure jobs will either consistently pass or fail.
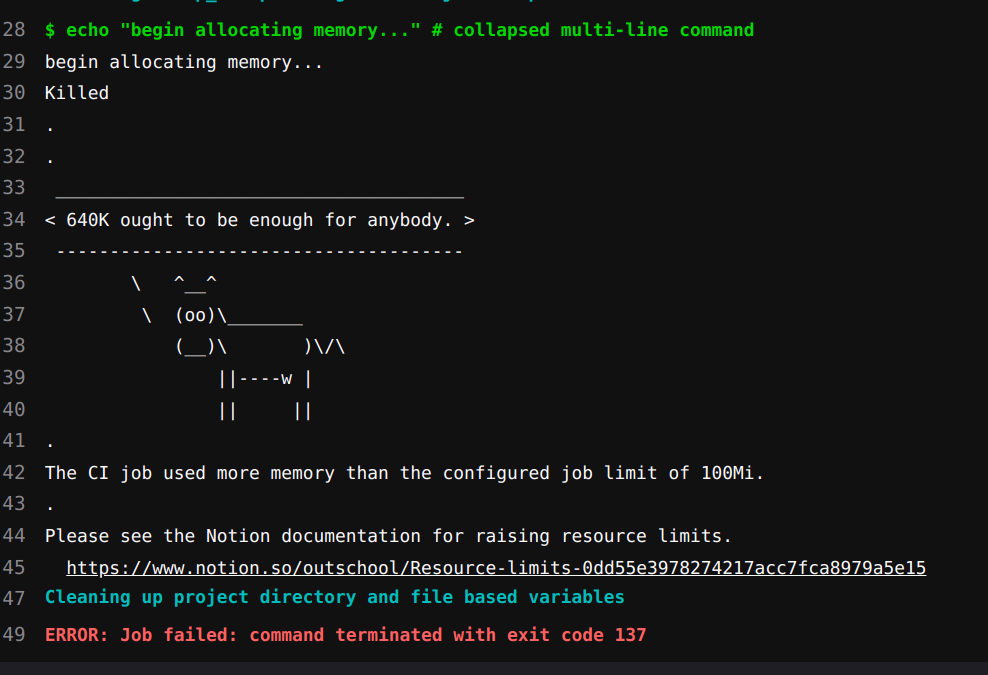
During the tuning process some jobs would either be too constrained for infrequent spikes or the job changed in such a way as to require more resources. In either case, the developer experience was lackluster. The memory limit is enforced by the host kernel which terminates the process. The runner simply sees the process exited with a non-zero status and fails the job. Depending on the process that caused the OOM condition there could be no log output, something vague like “killed,” or an error indicating memory exhaustion. Most of the time there was little to no output.
We developed a patch for the Gitlab Runner to detect the OOM failure and print a configurable message in the job log. The result is a pleasant developer experience that also reduces questions about CI job failures.
Custom Registry
The container registry proxy, described above, required deploying a custom registry within the k8s cluster and pulling images from that registry by the nodes. There is no first class support for internal registries, without publicly valid certificates, in k8s. The least cumbersome solution ended up being a daemonset that would add entries to /etc/hosts and install the certificates for use by the underlying container system (docker and later containerd). For jobs that build docker images and utilize the proxies for caching, the certificates were mounted from the host node into the docker-in-docker containers to allow for pulling within the CI job. The certificates were generated and signed using a k8s CSR and stored in a secret to be accessed by the daemonset.
The solution achieves the desired result without having to build a custom node image nor exposing the registries publicly. The only annoyance that remains is a lack of a method to prevent scheduling on a node until the daemonset has completed its setup. The simplest workaround is to enable multiple pull attempts in the runner configuration. Since the daemonset completes very quickly this is sufficient.
Benefits
Overall, we have been very satisfied by our Gitlab Runner on k8s. We accomplished our goals and then some with an implementation that was inline with our original plan.
Observability
Instead of vague answers or suggestions to observe locally, we can point to extensive metrics. Such metrics have proven to be useful outside of the original goal for CI job metrics in diagnosing underlying CI system problems and for effectively tuning. We are able to detect systemic problems proactively and have confidence that our updates are working correctly.
Optimization
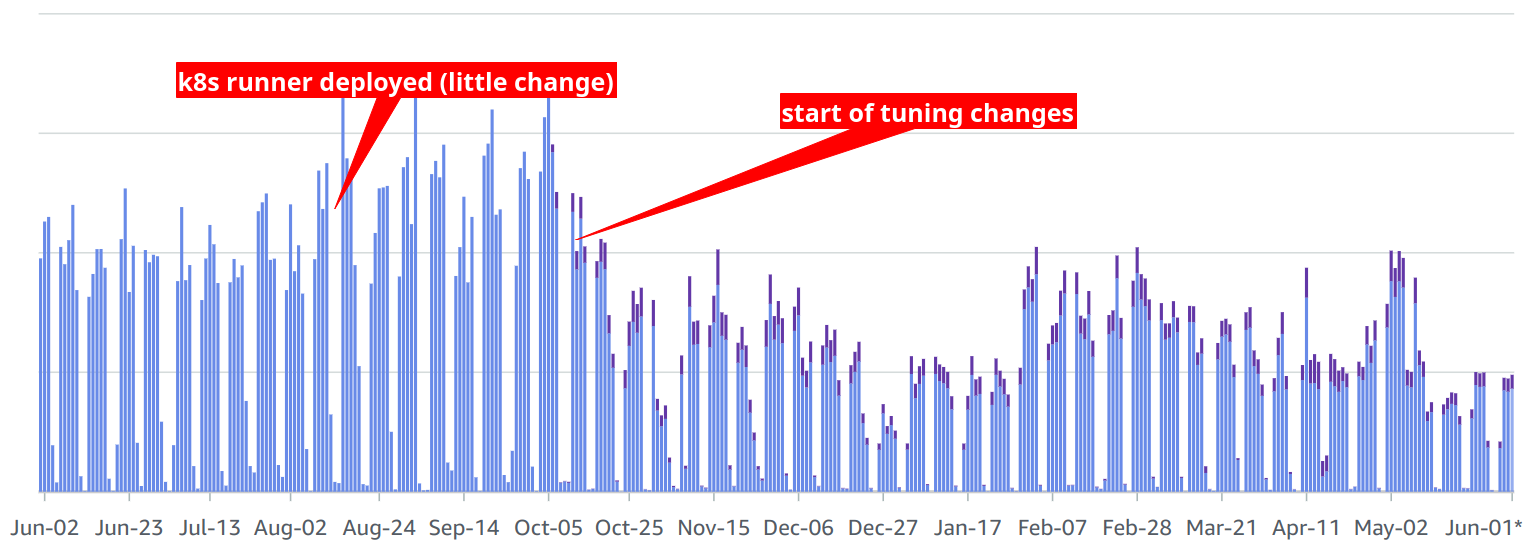
Our CI pipeline performance has substantially improved thanks to reduced startup overhead and specialized node pools. Surgically expanding the use of the specialized node pools has been trivial and effective. Between overhead reduction and tuning job resource requests we have managed to reduce CI cost dramatically, even while utilizing more expensive instances (purple on the graph).
The overall wait in our merge train has been substantially reduced in addition to the improved developer experience through a faster iteration cycle.
Reliability
Overall, the system has been very reliable and easy to monitor. When problems occur we can quickly get the details we need to either resolve the problem or understand what is responsible. Network transient errors have been dramatically reduced through the extensive use of caching. Updates have been straightforward and the setup can scale with us for the foreseeable future without reliance on the discontinued docker-machine.
Conclusion
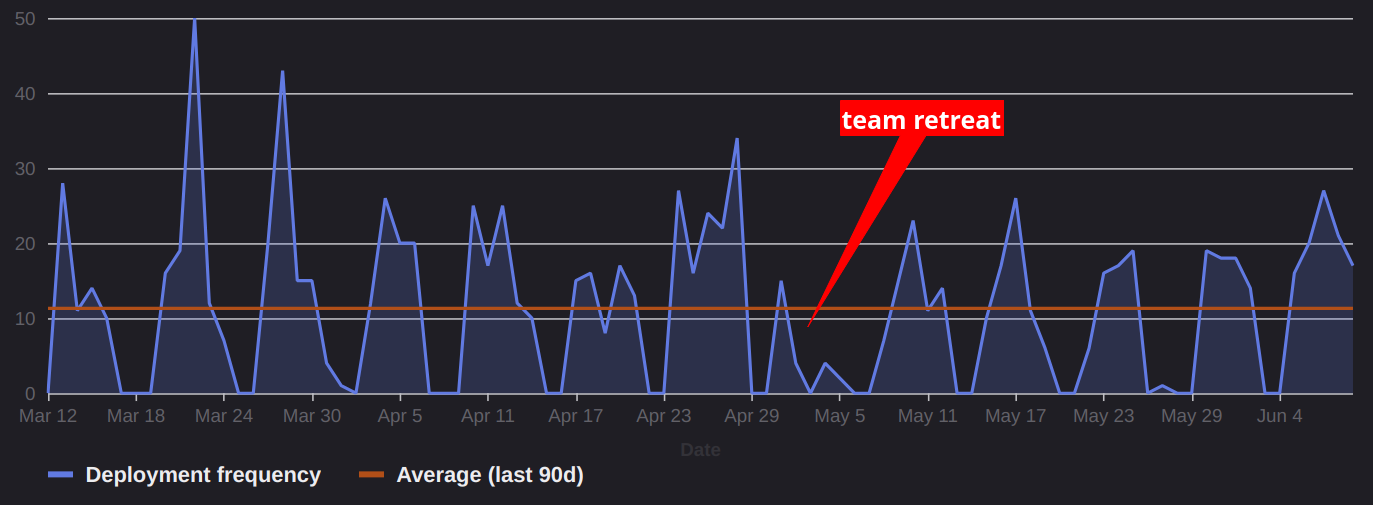
When all is said and done, a CI system should allow for consistent merging of changes and deployment to production. Making that possible is a combination of detailed CI definitions for building, testing, and deployment along with a reliable system for execution. Our daily merge and deployments are fairly consistent without large dips due to CI outages and we do not find ourselves fighting fires in our k8s cluster.
About the Author

Jimmy Berry
Software Engineer on the Infrastructure team at Outschool.